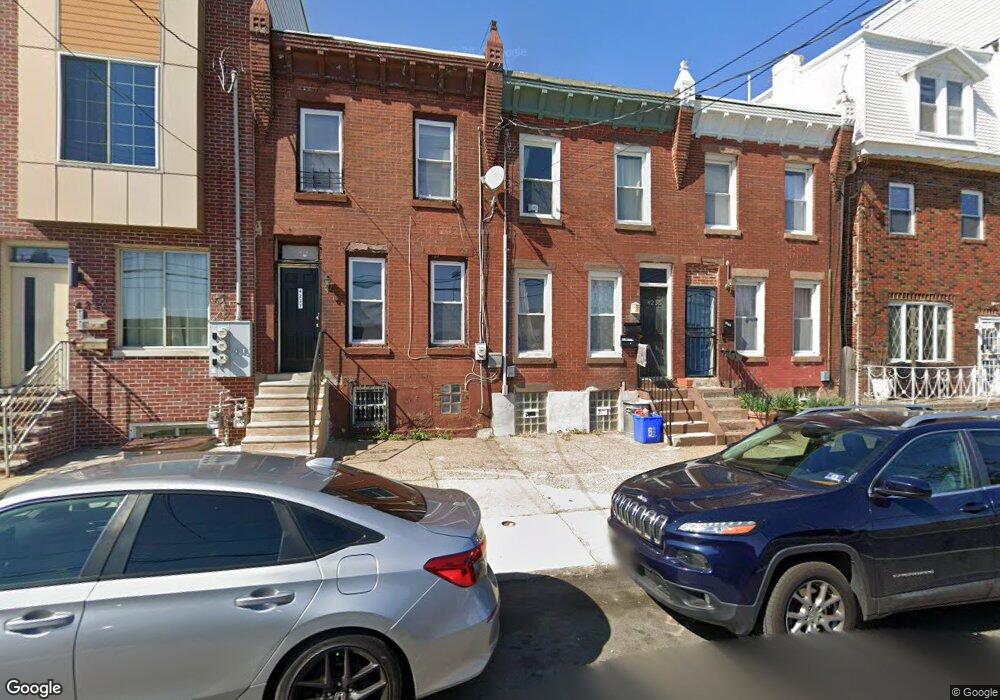
4235 Haverford Ave Unit 1 Philadelphia, PA 19104
Haverford North NeighborhoodEstimated Value: $330,000 - $338,645
2
Beds
1
Bath
700
Sq Ft
$477/Sq Ft
Est. Value
About This Home
This home is located at 4235 Haverford Ave Unit 1, Philadelphia, PA 19104 and is currently estimated at $334,215, approximately $477 per square foot. 4235 Haverford Ave Unit 1 is a home located in Philadelphia County with nearby schools including Alain Locke School, West Philadelphia High School, and KIPP Philadelphia Octavius Catto CS.
Ownership History
Date
Name
Owned For
Owner Type
Purchase Details
Closed on
May 19, 2022
Sold by
Jose Acosta Jr
Bought by
Tran Uyen
Current Estimated Value
Home Financials for this Owner
Home Financials are based on the most recent Mortgage that was taken out on this home.
Original Mortgage
$304,385
Outstanding Balance
$288,743
Interest Rate
5.25%
Mortgage Type
FHA
Estimated Equity
$45,472
Purchase Details
Closed on
Nov 27, 2018
Sold by
Brown Rudy and Baker Myron
Bought by
Acosta Jose and Fay Meredity
Home Financials for this Owner
Home Financials are based on the most recent Mortgage that was taken out on this home.
Original Mortgage
$260,423
Interest Rate
5.12%
Mortgage Type
FHA
Purchase Details
Closed on
Oct 23, 2007
Sold by
Walker Veronica
Bought by
Brown Rudy and Baker Myron
Purchase Details
Closed on
Aug 11, 2003
Sold by
Champion Mortgage
Bought by
Walker Veronica
Purchase Details
Closed on
Feb 21, 1995
Sold by
Hill Harry J and Harmon Gertrude
Bought by
Norris Craig E
Create a Home Valuation Report for This Property
The Home Valuation Report is an in-depth analysis detailing your home's value as well as a comparison with similar homes in the area
Home Values in the Area
Average Home Value in this Area
Purchase History
| Date | Buyer | Sale Price | Title Company |
|---|---|---|---|
| Tran Uyen | $310,000 | None Listed On Document | |
| Acosta Jose | $219,500 | None Available | |
| Brown Rudy | $37,000 | Independence Abstract & Titl | |
| Walker Veronica | $9,900 | -- | |
| Champion Mortgage Co Inc | $12,900 | -- | |
| Norris Craig E | -- | -- |
Source: Public Records
Mortgage History
| Date | Status | Borrower | Loan Amount |
|---|---|---|---|
| Open | Tran Uyen | $304,385 | |
| Previous Owner | Acosta Jose | $260,423 |
Source: Public Records
Tax History Compared to Growth
Tax History
| Year | Tax Paid | Tax Assessment Tax Assessment Total Assessment is a certain percentage of the fair market value that is determined by local assessors to be the total taxable value of land and additions on the property. | Land | Improvement |
|---|---|---|---|---|
| 2026 | $3,089 | $293,000 | $58,600 | $234,400 |
| 2025 | $3,089 | $293,000 | $58,600 | $234,400 |
| 2024 | $3,089 | $293,000 | $58,600 | $234,400 |
| 2023 | $3,089 | $220,700 | $44,140 | $176,560 |
| 2022 | $1,768 | $220,700 | $44,140 | $176,560 |
| 2021 | $1,768 | $0 | $0 | $0 |
| 2020 | $1,768 | $0 | $0 | $0 |
| 2019 | $1,702 | $0 | $0 | $0 |
| 2018 | $1,515 | $0 | $0 | $0 |
| 2017 | $1,530 | $0 | $0 | $0 |
| 2016 | $1,530 | $0 | $0 | $0 |
| 2015 | $10,680 | $0 | $0 | $0 |
| 2014 | -- | $109,300 | $5,064 | $104,236 |
| 2012 | -- | $7,040 | $1,888 | $5,152 |
Source: Public Records
Map
Nearby Homes
- 4220 Wallace St
- 617 N Hutton St
- 629 N Hutton St
- 4231 Haverford Ave
- 638 Hutton St
- 627 Hutton St
- 619 Hutton St
- 636 Hutton St
- 4310 Wallace St
- 4303 Haverford Ave
- 518 N Holly St
- 318 20 Budd St
- 4130 42 Aspen St
- 4234 Aspen St
- 4207 Aspen St
- 4052 Lancaster Ave
- 508 N Budd St
- 661 Brooklyn St
- 644 Brooklyn St
- 770 Brooklyn St
- 4235 Haverford Ave
- 4233 Haverford Ave
- 4237 Haverford Ave
- 4239 Haverford Ave Unit 2
- 4239 Haverford Ave Unit 1
- 4239 Haverford Ave
- 4229 Haverford Ave
- 4227 Haverford Ave
- 4225 Haverford Ave
- 608 N Brooklyn St
- 4223 Haverford Ave
- 610 N Brooklyn St
- 612 N Brooklyn St
- 4221 Haverford Ave
- 616 N Brooklyn St
- 614 N Brooklyn St
- 618 N Brooklyn St
- 620 N Brooklyn St
- 4219 Haverford Ave
- 4217 Haverford Ave