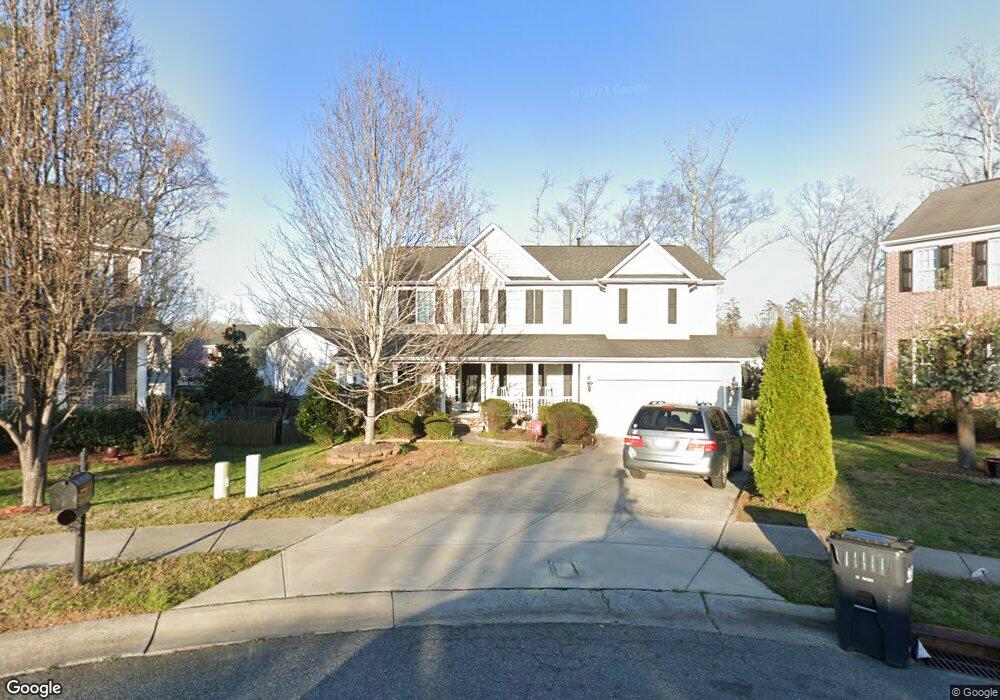
4235 Nathaniel Glen Ct Matthews, NC 28105
Providence NeighborhoodEstimated Value: $735,711 - $777,000
4
Beds
3
Baths
4,980
Sq Ft
$151/Sq Ft
Est. Value
About This Home
This home is located at 4235 Nathaniel Glen Ct, Matthews, NC 28105 and is currently estimated at $754,428, approximately $151 per square foot. 4235 Nathaniel Glen Ct is a home located in Mecklenburg County with nearby schools including Matthews Elementary, Crestdale Middle School, and Butler High School.
Ownership History
Date
Name
Owned For
Owner Type
Purchase Details
Closed on
Aug 22, 2018
Sold by
Schottland Paul J
Bought by
Schottland Julie Muenze
Current Estimated Value
Home Financials for this Owner
Home Financials are based on the most recent Mortgage that was taken out on this home.
Original Mortgage
$252,000
Outstanding Balance
$218,852
Interest Rate
4.5%
Mortgage Type
New Conventional
Estimated Equity
$535,576
Purchase Details
Closed on
Oct 28, 2005
Sold by
K Hovnanian Homes Of North Carolina Inc
Bought by
Schottland Paul J and Schottland Julie
Home Financials for this Owner
Home Financials are based on the most recent Mortgage that was taken out on this home.
Original Mortgage
$254,781
Interest Rate
6%
Mortgage Type
Fannie Mae Freddie Mac
Purchase Details
Closed on
Apr 30, 2003
Sold by
Randy Humphrey & Associates Inc
Bought by
The New Fortis Corp
Create a Home Valuation Report for This Property
The Home Valuation Report is an in-depth analysis detailing your home's value as well as a comparison with similar homes in the area
Home Values in the Area
Average Home Value in this Area
Purchase History
| Date | Buyer | Sale Price | Title Company |
|---|---|---|---|
| Schottland Julie Muenze | -- | None Available | |
| Schottland Paul J | $318,500 | Investors Title Insurance Co | |
| The New Fortis Corp | $642,000 | -- |
Source: Public Records
Mortgage History
| Date | Status | Borrower | Loan Amount |
|---|---|---|---|
| Open | Schottland Julie Muenze | $252,000 | |
| Closed | Schottland Paul J | $254,781 |
Source: Public Records
Tax History Compared to Growth
Tax History
| Year | Tax Paid | Tax Assessment Tax Assessment Total Assessment is a certain percentage of the fair market value that is determined by local assessors to be the total taxable value of land and additions on the property. | Land | Improvement |
|---|---|---|---|---|
| 2025 | $4,535 | $578,600 | $100,000 | $478,600 |
| 2024 | $4,535 | $578,600 | $100,000 | $478,600 |
| 2023 | $4,383 | $578,600 | $100,000 | $478,600 |
| 2022 | $3,991 | $400,600 | $75,000 | $325,600 |
| 2021 | $3,980 | $400,600 | $75,000 | $325,600 |
| 2020 | $3,973 | $400,600 | $75,000 | $325,600 |
| 2019 | $3,957 | $400,600 | $75,000 | $325,600 |
| 2018 | $4,295 | $321,800 | $52,300 | $269,500 |
| 2016 | $4,219 | $321,800 | $52,300 | $269,500 |
| 2015 | $4,207 | $321,800 | $52,300 | $269,500 |
| 2014 | $4,344 | $333,400 | $52,300 | $281,100 |
Source: Public Records
Map
Nearby Homes
- 2517 Sandy Ridge Ln
- 3107 Huntington Ridge Ct
- 3915 Cameron Run Ln
- 3926 Cameron Creek Dr
- 2306 Nettleton Ct
- 1221 Over Stream Ln
- 1200 Over Stream Ln
- 7403 Lamplighter Close Dr
- 1009 Murandy Ln
- 1314 Sarandon Dr
- 3109 Savannah Hills Dr
- 4028 Tew Ct
- 1121 Yarrow St
- 1227 Clover Ln
- 1348 Millbank Dr
- 7229 Corduroy Ct
- 3536 Arborhill Rd
- 1024 Kensrowe Ln
- 2459 Coltsview Ln Unit 2459
- 3318 Providence Hills Dr
- 4238 Nathaniel Glen Ct
- 4231 Nathaniel Glen Ct
- 3511 Cameron Creek Dr
- 4148 Oakton Ridge Ct
- 3505 Cameron Creek Dr
- 4234 Nathaniel Glen Ct
- 3517 Cameron Creek Dr
- 4230 Nathaniel Glen Ct
- 4142 Oakton Ridge Ct
- 4155 Oakton Ridge Ct
- 4224 Nathaniel Glen Ct
- 3523 Cameron Creek Dr
- 4219 Nathaniel Glen Ct
- 4134 Oakton Ridge Ct
- 3500 Cameron Creek Dr
- 4151 Oakton Ridge Ct
- 4218 Nathaniel Glen Ct
- 4147 Oakton Ridge Ct
- 4213 Nathaniel Glen Ct
- 4128 Oakton Ridge Ct