4235 Orchard Loop Tillamook, OR 97141
Estimated Value: $406,233 - $447,000
3
Beds
2
Baths
1,412
Sq Ft
$299/Sq Ft
Est. Value
About This Home
This home is located at 4235 Orchard Loop, Tillamook, OR 97141 and is currently estimated at $422,058, approximately $298 per square foot. 4235 Orchard Loop is a home located in Tillamook County with nearby schools including Tillamook High School.
Ownership History
Date
Name
Owned For
Owner Type
Purchase Details
Closed on
Apr 26, 2024
Sold by
Duncan Family Trust and Duncan Marie T
Bought by
Duncan Disclaimer Trust and Duncan
Current Estimated Value
Purchase Details
Closed on
Feb 2, 2011
Sold by
Duncan Thomas M and Duncan Marie T
Bought by
Duncan Thomas M and Duncan Marie T
Create a Home Valuation Report for This Property
The Home Valuation Report is an in-depth analysis detailing your home's value as well as a comparison with similar homes in the area
Purchase History
| Date | Buyer | Sale Price | Title Company |
|---|---|---|---|
| Duncan Disclaimer Trust | -- | None Listed On Document | |
| Duncan Thomas M | -- | None Available |
Source: Public Records
Tax History
| Year | Tax Paid | Tax Assessment Tax Assessment Total Assessment is a certain percentage of the fair market value that is determined by local assessors to be the total taxable value of land and additions on the property. | Land | Improvement |
|---|---|---|---|---|
| 2025 | $2,688 | $209,530 | $113,060 | $96,470 |
| 2024 | $2,569 | $203,430 | $109,770 | $93,660 |
| 2023 | $2,559 | $197,510 | $106,570 | $90,940 |
| 2022 | $2,488 | $191,760 | $103,470 | $88,290 |
| 2021 | $2,431 | $186,180 | $100,460 | $85,720 |
| 2020 | $2,378 | $180,760 | $97,530 | $83,230 |
| 2019 | $2,329 | $175,500 | $94,690 | $80,810 |
| 2018 | $2,284 | $170,390 | $91,930 | $78,460 |
| 2017 | $2,240 | $165,429 | $89,249 | $76,180 |
| 2016 | $2,169 | $160,620 | $86,660 | $73,960 |
| 2015 | $2,136 | $155,950 | $84,140 | $71,810 |
| 2014 | $2,102 | $151,410 | $81,690 | $69,720 |
| 2013 | -- | $147,000 | $79,310 | $67,690 |
Source: Public Records
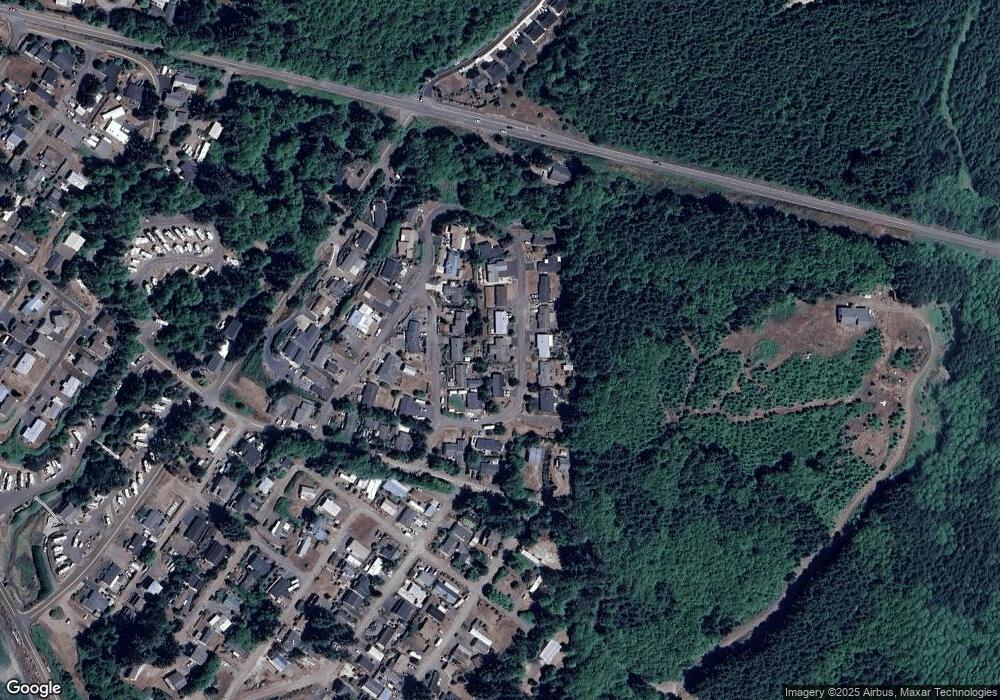
Map
Nearby Homes
- 1960 Alder Cove Rd W
- 0 Moondancer Ln Unit 25-198
- 0 Moondancer Ln Unit 62
- 4745 Netarts Hwy W
- 01100 Sequoia Loop
- Lot 116 Sequoia Loop
- 4380 Sequoia Loop
- 0 Sequoia Loop Unit 116 259912765
- 4805 Leonard St W
- 4789 Holly Heights Ave
- 218 Holly Heights Ave
- TL #212 Holly Heights Ave
- 212 Holly Heights Ave Unit 212
- 223 Holly Heights Ave
- 224 Holly Heights Ave
- TL 3800 Vista View Dr W
- 0 Tl 3800 Unit 479246395
- 1060 W First St
- 1060 1st St W
- 4955 Bourbon Place W
- 4245 Orchard Loop
- 2125 Orchard Ct
- Lot 62 Moondancer Ln
- 4225 Orchard Loop
- 2145 Orchard Ct
- 2105 Orchard Ct
- 2145 Orchard Ct W
- 4255 Orchard Loop
- 4240 Orchard Loop
- 4205 Orchard Loop
- 4205 Orchard Loop
- 4230 Orchard Loop
- 4250 Orchard Loop
- 4345 Orchard Loop
- 8285 Orchard Ct
- 4220 Orchard Loop
- 2140 Orchard Ct W
- 4260 Orchard Loop
- 2110 Orchard Ct
- 2110 Orchard Ct W
Your Personal Tour Guide
Ask me questions while you tour the home.