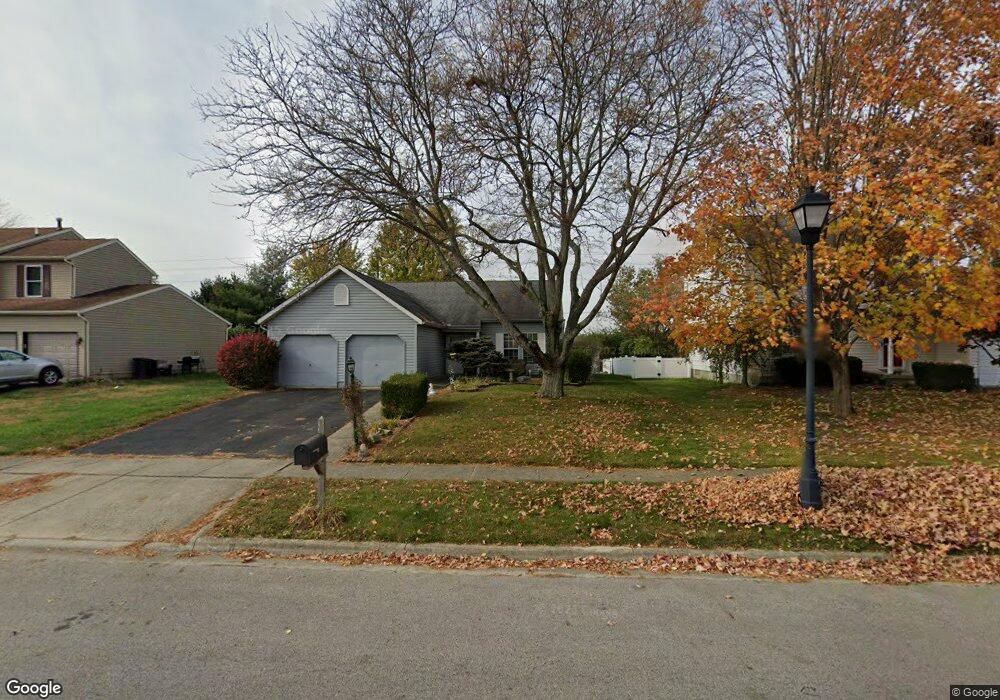
4235 Rockledge St Grove City, OH 43123
Estimated Value: $297,093 - $320,000
3
Beds
2
Baths
1,280
Sq Ft
$241/Sq Ft
Est. Value
About This Home
This home is located at 4235 Rockledge St, Grove City, OH 43123 and is currently estimated at $308,773, approximately $241 per square foot. 4235 Rockledge St is a home located in Franklin County with nearby schools including Park Street Intermediate School, Darbydale Elementary School, and Central Crossing High School.
Ownership History
Date
Name
Owned For
Owner Type
Purchase Details
Closed on
Jan 11, 2006
Sold by
Gray Melvin E and Hoffman Virginia
Bought by
Gray Melvin E
Current Estimated Value
Home Financials for this Owner
Home Financials are based on the most recent Mortgage that was taken out on this home.
Original Mortgage
$25,000
Interest Rate
6.34%
Mortgage Type
New Conventional
Purchase Details
Closed on
Feb 9, 1999
Sold by
Gray Melvin E
Bought by
Gray Melvin E
Purchase Details
Closed on
Jul 2, 1992
Create a Home Valuation Report for This Property
The Home Valuation Report is an in-depth analysis detailing your home's value as well as a comparison with similar homes in the area
Home Values in the Area
Average Home Value in this Area
Purchase History
| Date | Buyer | Sale Price | Title Company |
|---|---|---|---|
| Gray Melvin E | -- | Transconti | |
| Gray Melvin E | $60,000 | -- | |
| -- | $87,700 | -- |
Source: Public Records
Mortgage History
| Date | Status | Borrower | Loan Amount |
|---|---|---|---|
| Previous Owner | Gray Melvin E | $25,000 |
Source: Public Records
Tax History Compared to Growth
Tax History
| Year | Tax Paid | Tax Assessment Tax Assessment Total Assessment is a certain percentage of the fair market value that is determined by local assessors to be the total taxable value of land and additions on the property. | Land | Improvement |
|---|---|---|---|---|
| 2024 | $3,182 | $79,770 | $25,730 | $54,040 |
| 2023 | $3,165 | $79,765 | $25,725 | $54,040 |
| 2022 | $2,948 | $57,090 | $14,490 | $42,600 |
| 2021 | $3,005 | $57,090 | $14,490 | $42,600 |
| 2020 | $2,995 | $57,090 | $14,490 | $42,600 |
| 2019 | $2,586 | $47,470 | $12,080 | $35,390 |
| 2018 | $2,613 | $47,470 | $12,080 | $35,390 |
| 2017 | $2,608 | $47,470 | $12,080 | $35,390 |
| 2016 | $2,648 | $36,540 | $8,470 | $28,070 |
| 2015 | $2,649 | $36,540 | $8,470 | $28,070 |
| 2014 | $2,651 | $36,540 | $8,470 | $28,070 |
| 2013 | $1,317 | $38,465 | $8,925 | $29,540 |
Source: Public Records
Map
Nearby Homes
- 3884 Chickasaw Dr
- 4420 Belle Apple St
- Miramar Plan at Autumn Grove
- Rockford Plan at Autumn Grove
- Somerset Plan at Autumn Grove
- Carlisle Plan at Autumn Grove
- Birmingham Plan at Autumn Grove
- Sanibel Plan at Autumn Grove
- Truman Plan at Autumn Grove
- Hoover Plan at Autumn Grove
- Dallas Plan at Autumn Grove
- Abington Plan at Autumn Grove
- Chattanooga Plan at Autumn Grove
- 4399 Rishel St
- 0 Elm St
- 3864 Brody Dr
- 4270 Broadway
- 3502 Stephen St
- 4161 Casa Blvd
- 4314 Robin St
- 4243 Rockledge St
- 4227 Rockledge St
- 4217 Rockledge St
- 4253 Rockledge St
- 3866 Sanwood Ct
- 4209 Rockledge St
- 4261 Rockledge St
- 3861 Sanwood Ct
- 4216 Rockledge St
- 3856 Sanwood Ct
- 4201 Rockledge St
- 4262 Rockledge St
- 3886 Rimrock Ave
- 4208 Rockledge St
- 3846 Sanwood Ct
- 4191 Rockledge St
- 4272 Rockledge St
- 3851 Sanwood Ct
- 3839 Redwood Ct
- 3841 Redwood Ct