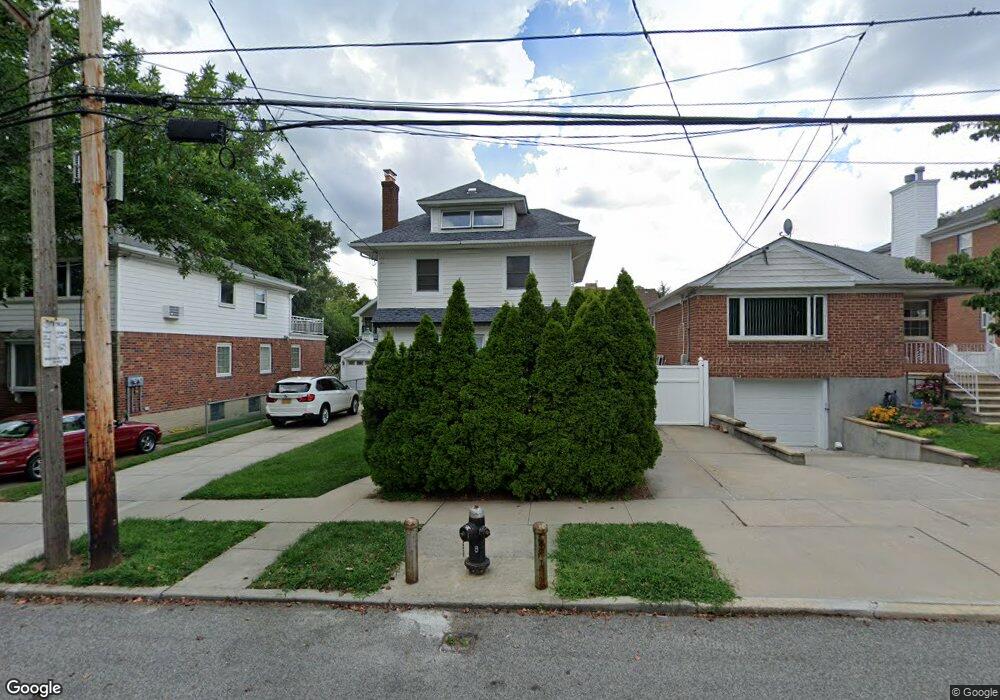
4236 205th St Bayside, NY 11361
Auburndale NeighborhoodEstimated Value: $1,273,851 - $1,503,000
--
Bed
--
Bath
2,232
Sq Ft
$635/Sq Ft
Est. Value
About This Home
This home is located at 4236 205th St, Bayside, NY 11361 and is currently estimated at $1,417,213, approximately $634 per square foot. 4236 205th St is a home located in Queens County with nearby schools including P.S. 31 - Bayside, I.S. 25 Adrien Block, and Francis Lewis High School.
Ownership History
Date
Name
Owned For
Owner Type
Purchase Details
Closed on
Jul 26, 2010
Sold by
Calder-Spielholz Priscilla and Spielholz Michael
Bought by
Lin Xiu Qing and Liu Hong Jian
Current Estimated Value
Home Financials for this Owner
Home Financials are based on the most recent Mortgage that was taken out on this home.
Original Mortgage
$410,000
Outstanding Balance
$273,642
Interest Rate
4.73%
Mortgage Type
Purchase Money Mortgage
Estimated Equity
$1,143,571
Purchase Details
Closed on
Jul 1, 2008
Sold by
Calder Priscilla Houston and Calder-Spinelli Julye
Bought by
Calder-Spielholz Priscilla and Spielholz Michael
Home Financials for this Owner
Home Financials are based on the most recent Mortgage that was taken out on this home.
Original Mortgage
$400,000
Interest Rate
6.17%
Mortgage Type
Purchase Money Mortgage
Purchase Details
Closed on
Jun 8, 1995
Sold by
Calder Alexander B and Calder Carmen
Bought by
Calder Priscilla Houston and Spinelli Julye Perez Calder
Create a Home Valuation Report for This Property
The Home Valuation Report is an in-depth analysis detailing your home's value as well as a comparison with similar homes in the area
Home Values in the Area
Average Home Value in this Area
Purchase History
| Date | Buyer | Sale Price | Title Company |
|---|---|---|---|
| Lin Xiu Qing | $690,000 | -- | |
| Lin Xiu Qing | $690,000 | -- | |
| Calder-Spielholz Priscilla | $290,000 | -- | |
| Calder-Spielholz Priscilla | $290,000 | -- | |
| Calder Priscilla Houston | -- | -- | |
| Calder Priscilla Houston | -- | -- |
Source: Public Records
Mortgage History
| Date | Status | Borrower | Loan Amount |
|---|---|---|---|
| Open | Lin Xiu Qing | $410,000 | |
| Closed | Lin Xiu Qing | $410,000 | |
| Previous Owner | Calder-Spielholz Priscilla | $400,000 |
Source: Public Records
Tax History Compared to Growth
Tax History
| Year | Tax Paid | Tax Assessment Tax Assessment Total Assessment is a certain percentage of the fair market value that is determined by local assessors to be the total taxable value of land and additions on the property. | Land | Improvement |
|---|---|---|---|---|
| 2025 | $10,376 | $54,761 | $11,887 | $42,874 |
| 2024 | $10,376 | $51,662 | $12,725 | $38,937 |
| 2023 | $9,789 | $48,739 | $10,369 | $38,370 |
| 2022 | $9,180 | $74,460 | $16,020 | $58,440 |
| 2021 | $9,677 | $79,260 | $16,020 | $63,240 |
| 2020 | $9,659 | $78,240 | $16,020 | $62,220 |
| 2019 | $9,006 | $74,160 | $16,020 | $58,140 |
| 2018 | $8,280 | $40,616 | $10,539 | $30,077 |
| 2017 | $7,811 | $38,319 | $10,345 | $27,974 |
| 2016 | $7,660 | $38,319 | $10,345 | $27,974 |
| 2015 | $4,360 | $38,028 | $13,256 | $24,772 |
| 2014 | $4,360 | $35,877 | $13,874 | $22,003 |
Source: Public Records
Map
Nearby Homes
- 4215 204th St
- 42-32 204th St
- 204-06 42nd Ave
- 43-19 205th St
- 40-40 203rd St Unit 12B
- 40- 41 202nd St
- 4005 203rd St
- 43-24 208th St
- 42-36 201st St
- 4304 209th St
- 202-30 45th Rd
- 209-10 41st Ave Unit 2J
- 206-16 45th Rd
- 206-18 45th Rd
- 207-15 39th Ave
- 200-29 45th Rd
- 206-38 45th Rd
- 20222 45th Dr
- 202-04 45th Dr
- 196-19 42nd Rd