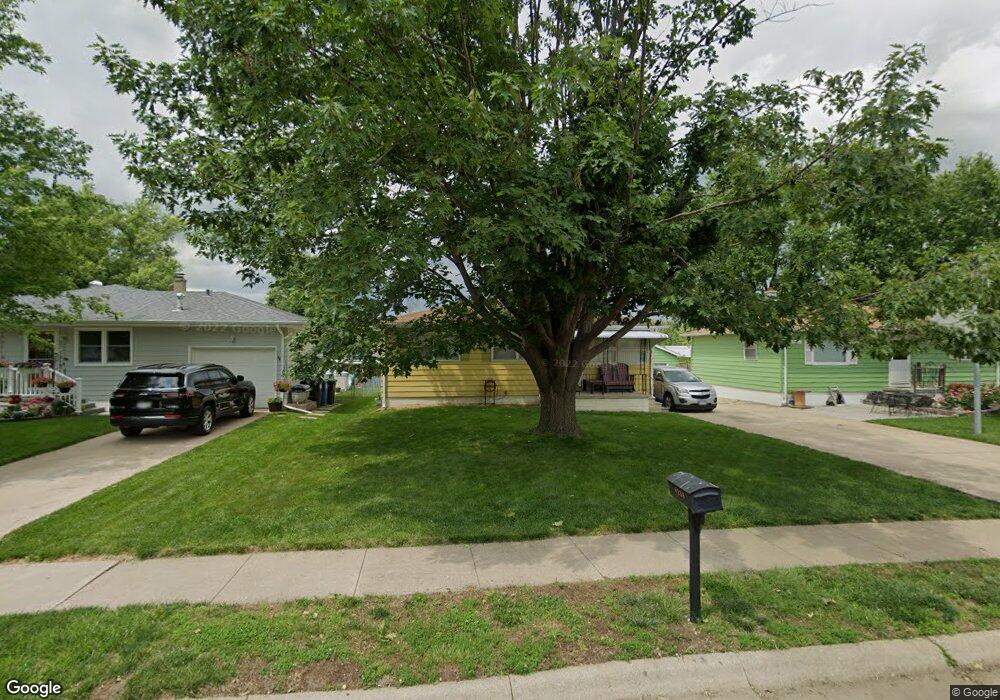
4236 E St Omaha, NE 68107
South Central Omaha NeighborhoodEstimated Value: $177,000 - $218,000
3
Beds
1
Bath
910
Sq Ft
$218/Sq Ft
Est. Value
About This Home
This home is located at 4236 E St, Omaha, NE 68107 and is currently estimated at $198,749, approximately $218 per square foot. 4236 E St is a home located in Douglas County with nearby schools including Ashland Park-Robbins Elementary School, St Thomas More School, and St. Peter Claver Christo Rey High School.
Ownership History
Date
Name
Owned For
Owner Type
Purchase Details
Closed on
Nov 19, 2001
Sold by
Savicky Gerald D and Savicky Christine
Bought by
Ewer Michael A and Ewer Elizabeth J
Current Estimated Value
Home Financials for this Owner
Home Financials are based on the most recent Mortgage that was taken out on this home.
Original Mortgage
$71,925
Interest Rate
6.77%
Mortgage Type
VA
Purchase Details
Closed on
Oct 25, 2001
Sold by
Savicky Gerald D and Savicky Christine
Bought by
Ewer Michael A and Ewer Elizabeth J
Home Financials for this Owner
Home Financials are based on the most recent Mortgage that was taken out on this home.
Original Mortgage
$71,925
Interest Rate
6.77%
Mortgage Type
VA
Create a Home Valuation Report for This Property
The Home Valuation Report is an in-depth analysis detailing your home's value as well as a comparison with similar homes in the area
Home Values in the Area
Average Home Value in this Area
Purchase History
| Date | Buyer | Sale Price | Title Company |
|---|---|---|---|
| Ewer Michael A | -- | Tower Title & Escrow | |
| Ewer Michael A | $70,000 | Tower Title & Escrow Co |
Source: Public Records
Mortgage History
| Date | Status | Borrower | Loan Amount |
|---|---|---|---|
| Previous Owner | Ewer Michael A | $71,925 |
Source: Public Records
Tax History
| Year | Tax Paid | Tax Assessment Tax Assessment Total Assessment is a certain percentage of the fair market value that is determined by local assessors to be the total taxable value of land and additions on the property. | Land | Improvement |
|---|---|---|---|---|
| 2025 | $2,668 | $165,000 | $14,300 | $150,700 |
| 2024 | $3,481 | $165,000 | $14,300 | $150,700 |
| 2023 | $3,481 | $165,000 | $14,300 | $150,700 |
| 2022 | $3,065 | $143,600 | $15,200 | $128,400 |
| 2021 | $2,529 | $119,500 | $15,200 | $104,300 |
| 2020 | $2,126 | $99,300 | $15,200 | $84,100 |
| 2019 | $2,132 | $99,300 | $15,200 | $84,100 |
| 2018 | $2,060 | $95,800 | $15,200 | $80,600 |
| 2017 | $1,856 | $85,900 | $6,400 | $79,500 |
| 2016 | $1,843 | $85,900 | $6,400 | $79,500 |
| 2015 | $1,819 | $85,900 | $6,400 | $79,500 |
| 2014 | $1,819 | $85,900 | $6,400 | $79,500 |
Source: Public Records
Map
Nearby Homes
Your Personal Tour Guide
Ask me questions while you tour the home.