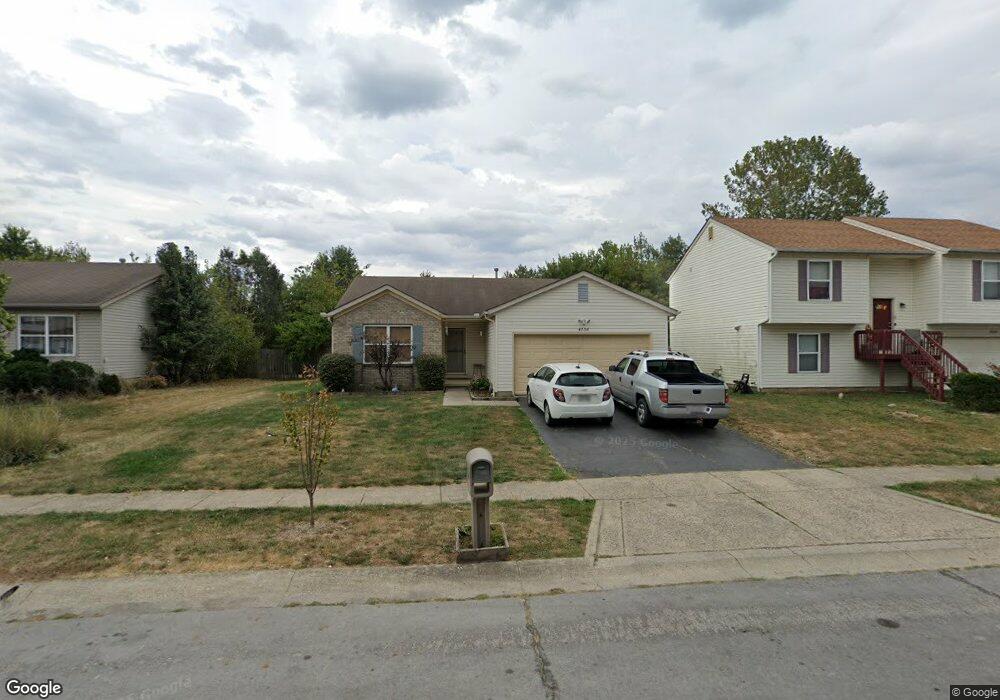
4236 Nipigon Dr Columbus, OH 43207
Obetz-Lockbourne NeighborhoodEstimated Value: $219,991 - $272,000
3
Beds
2
Baths
1,118
Sq Ft
$221/Sq Ft
Est. Value
About This Home
This home is located at 4236 Nipigon Dr, Columbus, OH 43207 and is currently estimated at $247,248, approximately $221 per square foot. 4236 Nipigon Dr is a home located in Franklin County with nearby schools including Hamilton Elementary School, Hamilton Intermediate School, and Hamilton Middle School.
Ownership History
Date
Name
Owned For
Owner Type
Purchase Details
Closed on
Dec 28, 2009
Sold by
Morequity Inc
Bought by
Wall Mark D and Wall Janet M
Current Estimated Value
Purchase Details
Closed on
Dec 17, 2009
Sold by
Scott Norma J and Case #09Cve 3 3603
Bought by
Morequity Inc
Create a Home Valuation Report for This Property
The Home Valuation Report is an in-depth analysis detailing your home's value as well as a comparison with similar homes in the area
Home Values in the Area
Average Home Value in this Area
Purchase History
| Date | Buyer | Sale Price | Title Company |
|---|---|---|---|
| Wall Mark D | $59,000 | Attorney | |
| Morequity Inc | $70,000 | Attorney |
Source: Public Records
Tax History Compared to Growth
Tax History
| Year | Tax Paid | Tax Assessment Tax Assessment Total Assessment is a certain percentage of the fair market value that is determined by local assessors to be the total taxable value of land and additions on the property. | Land | Improvement |
|---|---|---|---|---|
| 2024 | $2,717 | $68,670 | $23,450 | $45,220 |
| 2023 | $2,673 | $68,670 | $23,450 | $45,220 |
| 2022 | $1,927 | $44,950 | $9,700 | $35,250 |
| 2021 | $1,959 | $44,950 | $9,700 | $35,250 |
| 2020 | $2,004 | $44,950 | $9,700 | $35,250 |
| 2019 | $1,863 | $38,120 | $8,090 | $30,030 |
| 2018 | $1,782 | $38,120 | $8,090 | $30,030 |
| 2017 | $1,887 | $38,120 | $8,090 | $30,030 |
| 2016 | $1,782 | $33,680 | $7,110 | $26,570 |
| 2015 | $1,711 | $31,930 | $7,110 | $24,820 |
| 2014 | $1,717 | $31,930 | $7,110 | $24,820 |
| 2013 | $880 | $33,600 | $7,490 | $26,110 |
Source: Public Records
Map
Nearby Homes
- 1187 Rendezvous Ln
- 4451 1/2 Lockbourne Rd Unit R
- 1341 Halfhill Way
- 1097 Rendezvous Ln
- 1101 Meadow Ln
- 1091 Vernon Dr
- 4207 Crosspointe Dr
- 965 Radbourne Dr
- 1566 Chillicothe St
- 1632 Marlboro Ave
- 1649 Obetz Ave
- 4410 Holstein Dr
- 989 Lavender Ln
- 1583 Metcalfe Ave
- 1597 Metcalfe Ave
- 1068 Tobi Dr
- 864 Robmeyer Dr
- 904 Kyle Ave
- 1456 Magoffin Ave
- 1118 Maplewood Rd
- 4244 Nipigon Dr
- 4228 Nipigon Dr
- 4252 Nipigon Dr
- 4220 Nipigon Dr
- 4260 Nipigon Dr
- 4212 Nipigon Dr
- 4237 Nipigon Dr
- 4245 Nipigon Dr
- 4229 Nipigon Dr
- 4268 Nipigon Dr
- 4253 Nipigon Dr
- 4221 Nipigon Dr
- 4204 Nipigon Dr
- 4261 Nipigon Dr
- 4276 Nipigon Dr
- 4213 Nipigon Dr
- 4196 Nipigon Dr
- 4269 Nipigon Dr
- 4205 Nipigon Dr
- 4284 Nipigon Dr