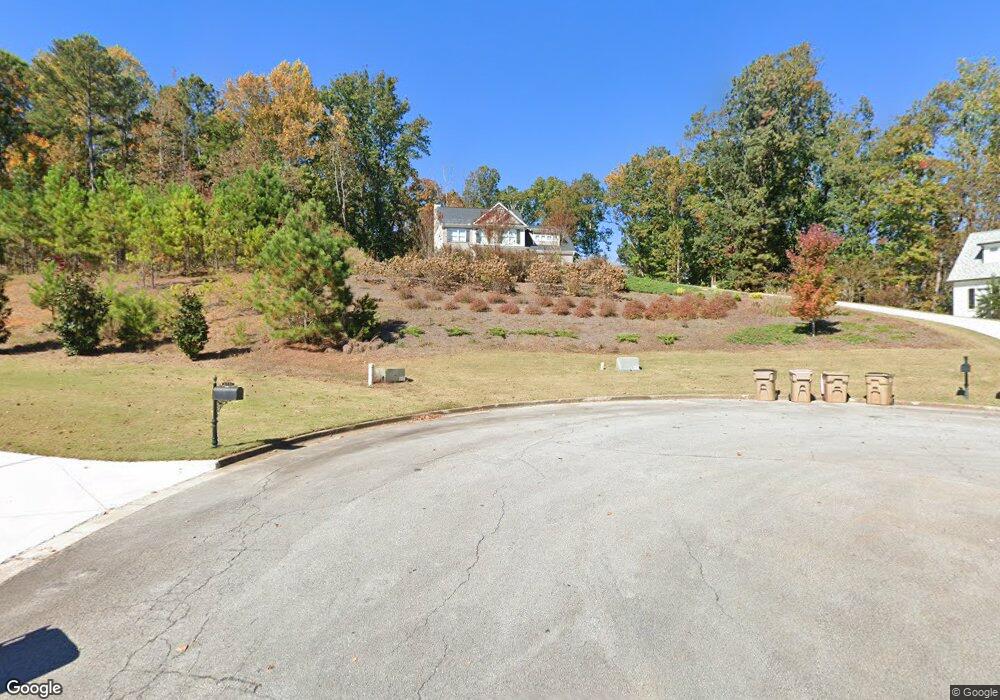
4237 Quail Creek Dr Unit 15 Flowery Branch, GA 30542
Estimated Value: $529,900 - $642,000
5
Beds
3
Baths
2,627
Sq Ft
$225/Sq Ft
Est. Value
About This Home
This home is located at 4237 Quail Creek Dr Unit 15, Flowery Branch, GA 30542 and is currently estimated at $590,225, approximately $224 per square foot. 4237 Quail Creek Dr Unit 15 is a home located in Hall County with nearby schools including Chestnut Mountain Elementary School, South Hall Middle School, and Johnson High School.
Ownership History
Date
Name
Owned For
Owner Type
Purchase Details
Closed on
Jul 2, 2019
Sold by
Moon Wilton
Bought by
Gurske David Michael and Gurske Kelly Rodgers
Current Estimated Value
Home Financials for this Owner
Home Financials are based on the most recent Mortgage that was taken out on this home.
Original Mortgage
$225,000
Outstanding Balance
$197,120
Interest Rate
3.82%
Mortgage Type
New Conventional
Estimated Equity
$393,105
Purchase Details
Closed on
Sep 18, 2018
Sold by
Atlanta Development Co Llc
Bought by
Moon Wilton and Moon Bridgitte
Home Financials for this Owner
Home Financials are based on the most recent Mortgage that was taken out on this home.
Original Mortgage
$285,000
Interest Rate
4.5%
Purchase Details
Closed on
May 16, 2013
Sold by
Rl Regi Georgia Llc
Bought by
Atlanta Development Co Llc
Purchase Details
Closed on
Sep 30, 2010
Sold by
Regions Bank
Bought by
Rl Regi Georgia Llc
Purchase Details
Closed on
Aug 4, 2009
Sold by
Bcm Developers Llc
Bought by
Regions Bank
Purchase Details
Closed on
Sep 29, 2006
Sold by
Chateau Corners Development Corp
Bought by
Bcm Developers Llc
Create a Home Valuation Report for This Property
The Home Valuation Report is an in-depth analysis detailing your home's value as well as a comparison with similar homes in the area
Home Values in the Area
Average Home Value in this Area
Purchase History
| Date | Buyer | Sale Price | Title Company |
|---|---|---|---|
| Gurske David Michael | $335,000 | -- | |
| Moon Wilton | $320,000 | -- | |
| Atlanta Development Co Llc | $650,000 | -- | |
| Rl Regi Georgia Llc | $488,700 | -- | |
| Regions Bank | -- | -- | |
| Bcm Developers Llc | $4,785,000 | -- |
Source: Public Records
Mortgage History
| Date | Status | Borrower | Loan Amount |
|---|---|---|---|
| Open | Gurske David Michael | $225,000 | |
| Previous Owner | Moon Wilton | $285,000 |
Source: Public Records
Tax History Compared to Growth
Tax History
| Year | Tax Paid | Tax Assessment Tax Assessment Total Assessment is a certain percentage of the fair market value that is determined by local assessors to be the total taxable value of land and additions on the property. | Land | Improvement |
|---|---|---|---|---|
| 2024 | $5,403 | $210,040 | $26,120 | $183,920 |
| 2023 | $4,592 | $177,320 | $20,800 | $156,520 |
| 2022 | $3,987 | $146,800 | $20,800 | $126,000 |
| 2021 | $3,714 | $133,600 | $16,000 | $117,600 |
| 2020 | $3,652 | $127,440 | $16,000 | $111,440 |
| 2019 | $3,424 | $117,960 | $16,000 | $101,960 |
| 2018 | $3,224 | $109,720 | $16,000 | $93,720 |
| 2017 | $411 | $10,000 | $10,000 | $0 |
| 2016 | $403 | $10,000 | $10,000 | $0 |
| 2015 | $400 | $10,000 | $10,000 | $0 |
| 2014 | $400 | $10,000 | $10,000 | $0 |
Source: Public Records
Map
Nearby Homes
- 4234 Quail Creek Dr
- 4226 Quail Creek Dr
- 4211 Quail Creek Dr
- 4135 Ashford Way
- 4621 Chartwell Chase Ct
- 4478 Longmead Rd
- 0 Marble Arch Way
- 4315 Marble Arch Way
- 3927 Celtic Ct
- 4835 Upper Berkshire Rd
- 4439 Oxburgh Park
- 4610 Blakeford Ct
- 4434 Oxburgh Park
- 4336 Woodfield Dr
- 4998 Planters Way
- 4708 Upper Berkshire Rd Unit 39
- 2460 Calvary Church Rd
- 4237 Quail Creek Dr
- 4433 Brush Creek Ct
- 4231 Quail Creek Dr
- 4424 Brush Creek Ct
- 4241 Quail Creek Dr Unit 14
- 4241 Quail Creek Dr
- 4246 Quail Creek Dr Unit 13
- 4246 Quail Creek Dr
- 4429 Brush Creek Ct Unit 20
- 4429 Brush Creek Ct
- 4425 Brush Creek Ct
- 4234 Quail Creek Dr Unit 10
- 0 Brush Creek Ct Unit 7443393
- 4421 Brush Creek Ct
- 4242 Quail Creek Dr
- 4406 Brush Creek Ct Unit 17
- 4406 Brush Creek Ct
- 4417 Brush Creek Ct
- 4334 Quail Creek Dr
- 4222 Quail Creek Dr