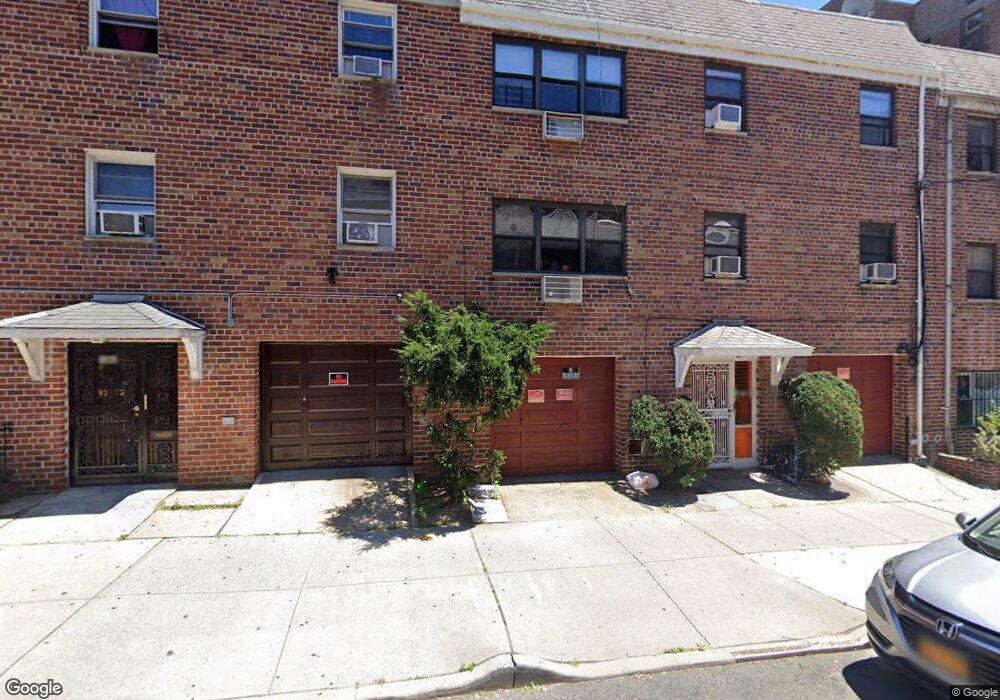
4238 Judge St Unit 5A Elmhurst, NY 11373
Elmhurst NeighborhoodEstimated Value: $606,000 - $660,000
--
Bed
--
Bath
1,179
Sq Ft
$539/Sq Ft
Est. Value
About This Home
This home is located at 4238 Judge St Unit 5A, Elmhurst, NY 11373 and is currently estimated at $635,095, approximately $538 per square foot. 4238 Judge St Unit 5A is a home located in Queens County with nearby schools including P.S. 7 Louis F Simeone, Is 5 The Walter Crowley Intermediate School, and Newtown High School.
Ownership History
Date
Name
Owned For
Owner Type
Purchase Details
Closed on
Feb 22, 2021
Sold by
Chen Yi Lu
Bought by
Prajapati Hasina and Tamang Sanjeeb Lama
Current Estimated Value
Home Financials for this Owner
Home Financials are based on the most recent Mortgage that was taken out on this home.
Original Mortgage
$488,000
Outstanding Balance
$436,462
Interest Rate
2.7%
Mortgage Type
Purchase Money Mortgage
Estimated Equity
$198,633
Purchase Details
Closed on
Jun 29, 2020
Sold by
Chen Yi Lu and Lin Xiu Yu
Bought by
Chen Yi Lu
Purchase Details
Closed on
Feb 28, 2007
Sold by
Top New York Inc
Bought by
Chen Yi Lu and Lin Xiu Yu
Home Financials for this Owner
Home Financials are based on the most recent Mortgage that was taken out on this home.
Original Mortgage
$240,000
Interest Rate
6.4%
Create a Home Valuation Report for This Property
The Home Valuation Report is an in-depth analysis detailing your home's value as well as a comparison with similar homes in the area
Home Values in the Area
Average Home Value in this Area
Purchase History
| Date | Buyer | Sale Price | Title Company |
|---|---|---|---|
| Prajapati Hasina | $610,000 | -- | |
| Prajapati Hasina | $610,000 | -- | |
| Chen Yi Lu | -- | -- | |
| Chen Yi Lu | -- | -- | |
| Chen Yi Lu | $419,796 | -- | |
| Chen Yi Lu | $419,796 | -- |
Source: Public Records
Mortgage History
| Date | Status | Borrower | Loan Amount |
|---|---|---|---|
| Open | Prajapati Hasina | $488,000 | |
| Closed | Prajapati Hasina | $488,000 | |
| Previous Owner | Chen Yi Lu | $240,000 |
Source: Public Records
Tax History Compared to Growth
Tax History
| Year | Tax Paid | Tax Assessment Tax Assessment Total Assessment is a certain percentage of the fair market value that is determined by local assessors to be the total taxable value of land and additions on the property. | Land | Improvement |
|---|---|---|---|---|
| 2025 | $315 | $92,524 | $748 | $91,776 |
| 2024 | $315 | $77,122 | $831 | $76,291 |
| 2023 | $315 | $64,268 | $1,009 | $63,259 |
| 2022 | $308 | $65,068 | $923 | $64,145 |
| 2021 | $309 | $76,580 | $923 | $75,657 |
| 2020 | $314 | $84,029 | $923 | $83,106 |
| 2019 | $317 | $76,777 | $923 | $75,854 |
| 2018 | $320 | $94,552 | $910 | $93,642 |
| 2017 | $320 | $87,549 | $896 | $86,653 |
| 2016 | $324 | $87,549 | $896 | $86,653 |
| 2015 | $253 | $84,835 | $906 | $83,929 |
| 2014 | $253 | $78,551 | $918 | $77,633 |
Source: Public Records
Map
Nearby Homes
- 42-38 Judge St Unit 3 A
- 42-38 Judge St Unit 2A
- 8510 Elmhurst Ave Unit 6B
- 40-66 Ithaca St Unit 6D
- 83-45 Vietor Ave Unit 7P
- 83-13 Britton Ave
- 44-10 Ketcham St Unit 3F
- 83-30 Vietor Ave Unit 417
- 83-30 Vietor Ave Unit 624
- 83-30 Vietor Ave Unit 716
- 83-30 Vietor Ave Unit 601
- 83-30 Vietor Ave Unit 603
- 83-30 Vietor Ave Unit 7C
- 83-30 Vietor Ave Unit 623
- 83-30 Vietor Ave Unit 109
- 83-10 Pettit Ave
- 83-08 Pettit Ave
- 83-25 Vietor Ave Unit 1
- 44-05 MacNish St Unit 2G
- 44-05 MacNish St Unit 1E
- 4238 Judge St
- 4238 Judge St Unit 5C
- 4238 Judge St Unit 5B
- 4238 Judge St Unit 3B
- 4238 Judge St Unit 3A
- 4238 Judge St Unit 2B
- 4238 Judge St Unit 2A
- 4238 Judge St Unit 1B
- 4238 Judge St Unit 1A
- 4234 Judge St
- 42-38 Judge St Unit 4Fl
- 42-38 Judge St Unit 4th Fl
- 42-38 Judge St Unit 5C
- 42-38 Judge St Unit 5
- 42-38 Judge St Unit 5B
- 42-38 Judge St Unit 2B
- 42-38 Judge St Unit 1B
- 42-38 Judge St Unit 5A
- 42-38 Judge St
- 4232 Judge St