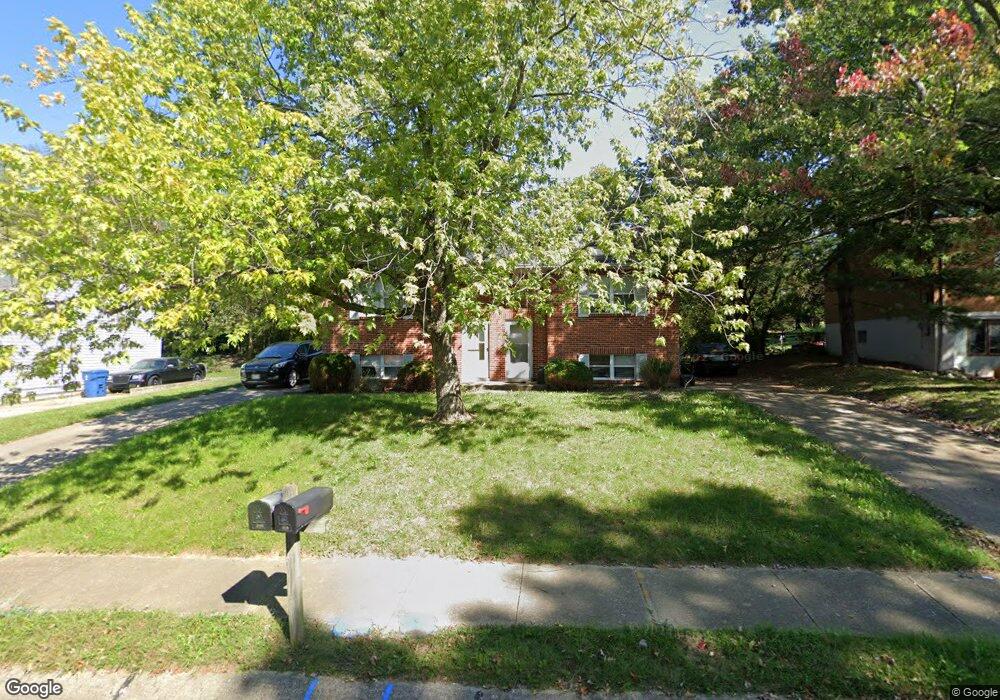
4238 Lafayette Ct Unit 4240 Erlanger, KY 41018
Estimated Value: $266,000 - $323,000
6
Beds
4
Baths
1,096
Sq Ft
$266/Sq Ft
Est. Value
About This Home
This home is located at 4238 Lafayette Ct Unit 4240, Erlanger, KY 41018 and is currently estimated at $291,563, approximately $266 per square foot. 4238 Lafayette Ct Unit 4240 is a home located in Kenton County with nearby schools including Miles Elementary School, Tichenor Middle School, and Lloyd Memorial High School.
Ownership History
Date
Name
Owned For
Owner Type
Purchase Details
Closed on
Jul 22, 2021
Sold by
Curtin John F and Curtin Maryann G
Bought by
10 Renshaw Ave Llc
Current Estimated Value
Home Financials for this Owner
Home Financials are based on the most recent Mortgage that was taken out on this home.
Original Mortgage
$142,500
Outstanding Balance
$88,261
Interest Rate
3%
Mortgage Type
Purchase Money Mortgage
Estimated Equity
$203,302
Purchase Details
Closed on
Feb 28, 2014
Sold by
Jansen Ryan D and Jansen Nicole
Bought by
Schabell Amanda Jansen and Schabell Andrew
Purchase Details
Closed on
Apr 13, 2000
Sold by
Kudera Kori L
Bought by
Jansen Ryan D and Jansen Amanda
Home Financials for this Owner
Home Financials are based on the most recent Mortgage that was taken out on this home.
Original Mortgage
$91,000
Interest Rate
8.29%
Mortgage Type
New Conventional
Create a Home Valuation Report for This Property
The Home Valuation Report is an in-depth analysis detailing your home's value as well as a comparison with similar homes in the area
Home Values in the Area
Average Home Value in this Area
Purchase History
| Date | Buyer | Sale Price | Title Company |
|---|---|---|---|
| 10 Renshaw Ave Llc | $190,000 | Kentucky Land Title Agency | |
| Schabell Amanda Jansen | $120,500 | Lawyers Title Cincinnati Inc | |
| Jansen Ryan D | $121,000 | -- |
Source: Public Records
Mortgage History
| Date | Status | Borrower | Loan Amount |
|---|---|---|---|
| Open | 10 Renshaw Ave Llc | $142,500 | |
| Previous Owner | Jansen Ryan D | $91,000 |
Source: Public Records
Tax History Compared to Growth
Tax History
| Year | Tax Paid | Tax Assessment Tax Assessment Total Assessment is a certain percentage of the fair market value that is determined by local assessors to be the total taxable value of land and additions on the property. | Land | Improvement |
|---|---|---|---|---|
| 2024 | $2,854 | $213,800 | $25,000 | $188,800 |
| 2023 | $2,792 | $213,800 | $25,000 | $188,800 |
| 2022 | $2,767 | $190,000 | $20,000 | $170,000 |
| 2021 | $1,808 | $120,500 | $20,000 | $100,500 |
| 2020 | $1,796 | $120,500 | $20,000 | $100,500 |
| 2019 | $1,769 | $120,500 | $20,000 | $100,500 |
| 2018 | $1,805 | $120,500 | $20,000 | $100,500 |
| 2017 | $1,683 | $120,500 | $20,000 | $100,500 |
| 2015 | $1,602 | $120,500 | $20,000 | $100,500 |
| 2014 | $1,555 | $120,500 | $20,000 | $100,500 |
Source: Public Records
Map
Nearby Homes
- 130 Pine Lake Dr Unit 2
- 159 Green River Dr Unit 4
- 417 Forest Ave
- 417 James Ave
- 120 Buckhorn Ct Unit 6
- 3917 Rankin Dr
- 3915 Rankin Dr
- 3 Drexel Ave
- 315 Mcalpin Ave
- 4117-4127 Dixie Hwy
- 4517 Dixie Hwy
- 26 Frieda Place
- 6859 Curtis Way
- 3514 Hulbert Ave
- 312 Graves Ave
- 332 Swan Cir
- 125 Commonwealth Ave
- 15 Sanders Dr
- 201 Erlanger Rd
- 309 Garvey Ave
- 4238 Lafayette Ct Unit 40
- 4234 Lafayette Ct
- 4242 Lafayette Ct Unit 44
- 4232 Lafayette Ct
- 4246 Lafayette Ct Unit 48
- 4246 Lafayette Ct Unit 4248
- 409 Cooper Pass
- 4241 Lafayette Ct Unit 43
- 4245 Lafayette Ct Unit 47
- 4248 Lafayette Ct
- 4237 Lafayette Ct
- 4249 Lafayette Ct Unit 51
- 4230 Lafayette Ct
- 4235 Lafayette Ct
- 4253 Lafayette Ct Unit 55
- 4250 Lafayette Ct Unit 52
- 401 Sunset Ave
- 4257 Lafayette Ct
- 4233 Lafayette Ct
- 409 Sunset Ave