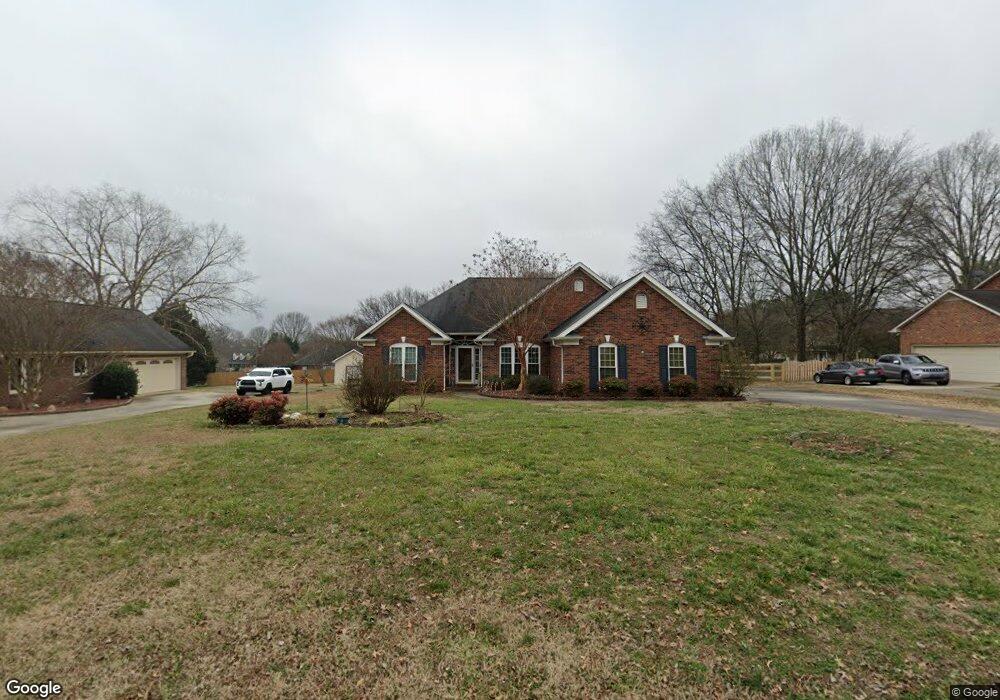
4238 Morris Burn Dr SW Concord, NC 28027
Estimated Value: $372,000 - $449,000
3
Beds
2
Baths
1,738
Sq Ft
$233/Sq Ft
Est. Value
About This Home
This home is located at 4238 Morris Burn Dr SW, Concord, NC 28027 and is currently estimated at $404,810, approximately $232 per square foot. 4238 Morris Burn Dr SW is a home located in Cabarrus County with nearby schools including Pitts School Road Elementary School, Roberta Road Middle School, and Jay M. Robinson High School.
Ownership History
Date
Name
Owned For
Owner Type
Purchase Details
Closed on
Apr 5, 2006
Sold by
Crook Ronald Dale
Bought by
Crook Kelly G
Current Estimated Value
Home Financials for this Owner
Home Financials are based on the most recent Mortgage that was taken out on this home.
Original Mortgage
$14,700
Interest Rate
5.89%
Mortgage Type
Fannie Mae Freddie Mac
Purchase Details
Closed on
May 2, 2000
Sold by
Brent Johnson Jimmy and Busch Lesa Marie
Bought by
Crook Ronald Dale and Crook Kelly G
Home Financials for this Owner
Home Financials are based on the most recent Mortgage that was taken out on this home.
Original Mortgage
$100,000
Interest Rate
8.23%
Purchase Details
Closed on
Jan 1, 1997
Bought by
Johnson Jimmy Brent
Create a Home Valuation Report for This Property
The Home Valuation Report is an in-depth analysis detailing your home's value as well as a comparison with similar homes in the area
Home Values in the Area
Average Home Value in this Area
Purchase History
| Date | Buyer | Sale Price | Title Company |
|---|---|---|---|
| Crook Kelly G | -- | None Available | |
| Crook Ronald Dale | $172,000 | -- | |
| Johnson Jimmy Brent | $26,000 | -- |
Source: Public Records
Mortgage History
| Date | Status | Borrower | Loan Amount |
|---|---|---|---|
| Closed | Crook Kelly G | $14,700 | |
| Open | Crook Kelly G | $76,901 | |
| Closed | Crook Ronald Dale | $100,000 |
Source: Public Records
Tax History Compared to Growth
Tax History
| Year | Tax Paid | Tax Assessment Tax Assessment Total Assessment is a certain percentage of the fair market value that is determined by local assessors to be the total taxable value of land and additions on the property. | Land | Improvement |
|---|---|---|---|---|
| 2025 | $3,839 | $385,480 | $100,000 | $285,480 |
| 2024 | $3,839 | $385,480 | $100,000 | $285,480 |
| 2023 | $3,199 | $262,240 | $65,000 | $197,240 |
| 2022 | $3,199 | $262,240 | $65,000 | $197,240 |
| 2021 | $3,199 | $262,240 | $65,000 | $197,240 |
| 2020 | $3,199 | $262,240 | $65,000 | $197,240 |
| 2019 | $2,870 | $235,280 | $55,000 | $180,280 |
| 2018 | $2,823 | $235,280 | $55,000 | $180,280 |
| 2017 | $2,776 | $235,280 | $55,000 | $180,280 |
| 2016 | $1,647 | $202,770 | $55,000 | $147,770 |
| 2015 | $2,351 | $202,770 | $55,000 | $147,770 |
| 2014 | $2,351 | $202,770 | $55,000 | $147,770 |
Source: Public Records
Map
Nearby Homes
- 4333 Glen Eagles Ln SW
- 4112 Alexis Ct SW
- 4114 Carolina Pointe Ct SW
- 706 King Fredrick Ln SW
- 4271 Millet St SW Unit 198
- 4266 Barley St SW
- 5366 Hardister Place
- 842 Treva Anne Dr SW
- 849 Treva Anne Dr SW
- 4370 Coddle Creek Dr
- 4901 Riverview Dr
- 5361 Brickyard Terrace Ct
- 5899 Crimson Oak Ct
- 3907 Melissa Dr
- 4349 Roberta Rd
- 287 Halton Crossing Dr SW
- 193 Halton Crossing Dr SW
- 5126 Rocky River Crossing Rd
- Lot 1 Morehead Rd
- 802 Patricia Ave
- 4252 Morris Burn Dr SW
- 4222 Morris Burn Dr SW
- 4381 Mackenzie Ct SW
- 4381 Mackenzie Ct SW Unit 7
- 4270 Morris Burn Dr SW
- 4345 Mackenzie Ct SW
- 4367 Mackenzie Ct SW
- 4239 Morris Burn Dr SW
- 4239 Morris Burn Dr SW Unit 50
- 4200 Morris Burn Dr SW
- 4220 Morris Burn Dr SW
- 4223 Morris Burn Dr SW
- 4253 Morris Burn Dr SW
- 4401 Mackenzie Ct SW Unit 8
- 4401 Mackenzie Ct SW
- 4299 Mackenzie Ct SW
- 4271 Morris Burn Dr SW
- 4207 Morris Burn Dr SW
- 4178 Morris Burn Dr SW
- 4400 Mackenzie Ct SW