Estimated Value: $1,768,000 - $3,707,123
3
Beds
2
Baths
1,720
Sq Ft
$1,809/Sq Ft
Est. Value
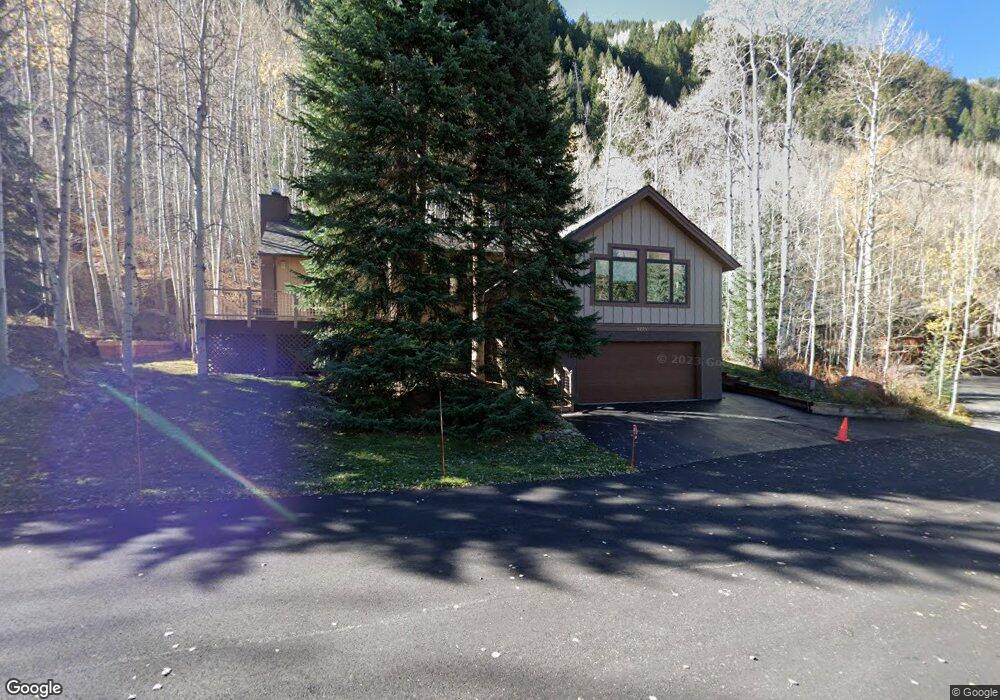
About This Home
This home is located at 4238 Nugget Ln, Vail, CO 81657 and is currently estimated at $3,111,781, approximately $1,809 per square foot. 4238 Nugget Ln is a home located in Eagle County with nearby schools including Red Sandstone Elementary School, Battle Mountain High School, and Vail Mountain School.
Ownership History
Date
Name
Owned For
Owner Type
Purchase Details
Closed on
May 28, 2024
Sold by
Johnson Kent W and Johnson Mary S
Bought by
Johnson Kent W and Johnson Mary S
Current Estimated Value
Purchase Details
Closed on
Sep 23, 2021
Sold by
Florek Robert C and Grewe Kathy
Bought by
Nugget Lane Llc
Purchase Details
Closed on
Jul 2, 1998
Sold by
Connelly Michael H and Connelly Sally S
Bought by
Johnson Kent W and Johnson Mary S
Purchase Details
Closed on
Oct 10, 1997
Sold by
Musyl Marc J
Bought by
Livaudais Durel
Purchase Details
Closed on
Oct 16, 1996
Sold by
Rievman David M
Bought by
Parker Sylvia and Sattler Suzanne
Home Financials for this Owner
Home Financials are based on the most recent Mortgage that was taken out on this home.
Original Mortgage
$230,600
Interest Rate
8.33%
Create a Home Valuation Report for This Property
The Home Valuation Report is an in-depth analysis detailing your home's value as well as a comparison with similar homes in the area
Home Values in the Area
Average Home Value in this Area
Purchase History
| Date | Buyer | Sale Price | Title Company |
|---|---|---|---|
| Johnson Kent W | -- | None Listed On Document | |
| Nugget Lane Llc | -- | None Available | |
| Johnson Kent W | $468,000 | Land Title | |
| Livaudais Durel | $283,750 | Land Title | |
| Parker Sylvia | $307,500 | -- |
Source: Public Records
Mortgage History
| Date | Status | Borrower | Loan Amount |
|---|---|---|---|
| Previous Owner | Parker Sylvia | $230,600 |
Source: Public Records
Tax History
| Year | Tax Paid | Tax Assessment Tax Assessment Total Assessment is a certain percentage of the fair market value that is determined by local assessors to be the total taxable value of land and additions on the property. | Land | Improvement |
|---|---|---|---|---|
| 2025 | $9,751 | $199,600 | $86,200 | $113,400 |
| 2024 | $10,093 | $212,210 | $83,570 | $128,640 |
| 2023 | $10,093 | $212,210 | $83,570 | $128,640 |
| 2022 | $6,587 | $128,170 | $65,180 | $62,990 |
| 2021 | $6,782 | $131,860 | $67,060 | $64,800 |
| 2020 | $5,624 | $110,820 | $61,140 | $49,680 |
| 2019 | $5,643 | $110,820 | $61,140 | $49,680 |
| 2018 | $6,770 | $130,310 | $51,640 | $78,670 |
| 2017 | $6,737 | $130,310 | $51,640 | $78,670 |
| 2016 | $5,264 | $102,940 | $63,430 | $39,510 |
| 2015 | -- | $102,940 | $63,430 | $39,510 |
| 2014 | $3,551 | $75,530 | $48,790 | $26,740 |
Source: Public Records
Map
Nearby Homes
- 4205 Columbine Way Unit 24
- 4335 Spruce Way
- 4192 Spruce Way Unit 109A109A
- 4469 Timber Falls Ct Unit 1901
- 4506 Spruce Way Unit 20
- 4479 Timber Falls Ct Unit 2001
- 4480 Timber Falls Ct Unit 1507
- 4470 Timber Falls Ct Unit 1405
- 4515 Bighorn Rd Unit H
- 4515 Bighorn Rd Unit F
- 4133 Spruce Way Unit 6
- 3988 Lupine Dr
- 4545 Bighorn Rd
- 4516 Meadow Dr Unit 807
- 4073 Spruce Way Unit 26
- 4570 Vail Racquet Club Dr Unit 21
- 4580 Vail Racquet Club Dr Unit 16
- 4600 Vail Racquet Club Dr Unit 6-10
- 3971 Bighorn Rd Unit 7-I
- 4610 Vail Racquet Club Dr Unit 2
- 4268 Nugget Ln
- 4229 Nugget Ln Unit B
- 4229 Nugget Ln Unit A
- 4229 Nugget Ln
- 4278 Nugget Ln Unit B
- 4278 Nugget Ln Unit A
- 4278 Nugget Ln
- 4278 Nugget Ln Unit A (W)
- 4239 Nugget Ln
- 4257 Nugget Ln
- 4267 Nugget Ln
- 4267 Nugget Ln
- 4267 Nugget Ln Unit B
- 4269 Nugget (West) Ln
- 4269 Nugget Ln
- 4269 Nugget Ln
- 4249 Nugget Ln
- 4288 Nugget Ln
- 4288 Nugget Ln Unit A
- 4288 Nugget Ln Unit B
Your Personal Tour Guide
Ask me questions while you tour the home.