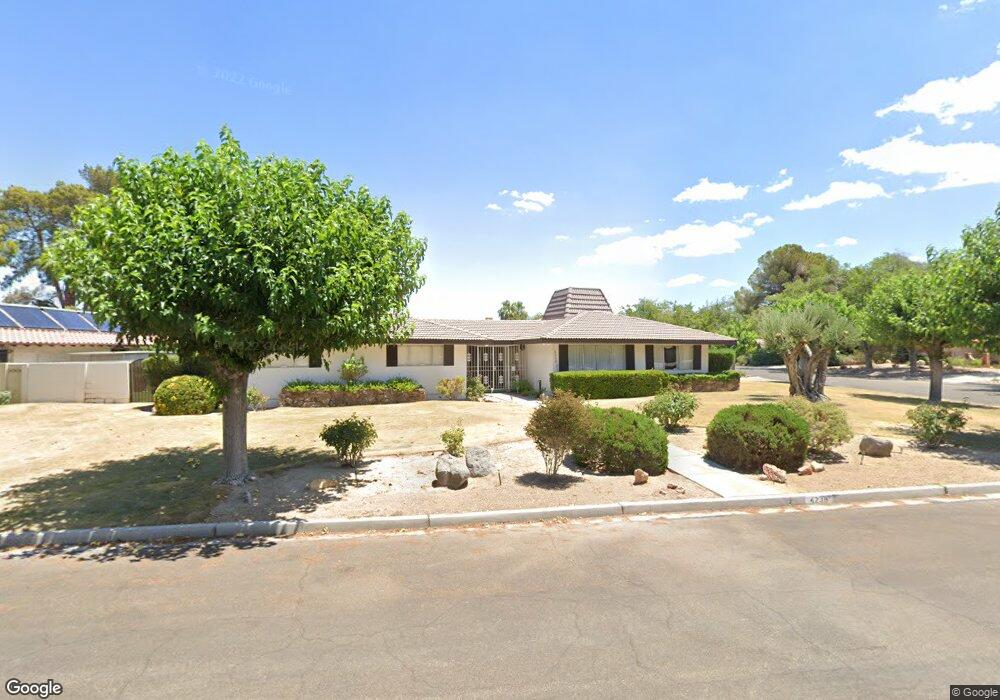
4238 W Pinecrest Cir Las Vegas, NV 89121
Paradise Valley East NeighborhoodEstimated Value: $641,260 - $695,000
3
Beds
2
Baths
2,036
Sq Ft
$327/Sq Ft
Est. Value
About This Home
This home is located at 4238 W Pinecrest Cir, Las Vegas, NV 89121 and is currently estimated at $666,565, approximately $327 per square foot. 4238 W Pinecrest Cir is a home located in Clark County with nearby schools including George E. Harris Elementary School, C.W. Woodbury Middle School, and Chaparral High School.
Ownership History
Date
Name
Owned For
Owner Type
Purchase Details
Closed on
Oct 22, 2019
Sold by
Garrett Bonnie S
Bought by
Garrett Bonnie S and Bj Living Trust
Current Estimated Value
Purchase Details
Closed on
Aug 3, 2017
Sold by
Garrett Bonnie S
Bought by
Garrett Bonnie S and Survivor S Trust Of The Charles H And Bo
Create a Home Valuation Report for This Property
The Home Valuation Report is an in-depth analysis detailing your home's value as well as a comparison with similar homes in the area
Home Values in the Area
Average Home Value in this Area
Purchase History
| Date | Buyer | Sale Price | Title Company |
|---|---|---|---|
| Garrett Bonnie S | -- | None Available | |
| Garrett Bonnie S | -- | None Available |
Source: Public Records
Tax History Compared to Growth
Tax History
| Year | Tax Paid | Tax Assessment Tax Assessment Total Assessment is a certain percentage of the fair market value that is determined by local assessors to be the total taxable value of land and additions on the property. | Land | Improvement |
|---|---|---|---|---|
| 2025 | $1,507 | $106,205 | $57,400 | $48,805 |
| 2024 | $1,507 | $106,205 | $57,400 | $48,805 |
| 2023 | $1,507 | $109,362 | $65,450 | $43,912 |
| 2022 | $1,464 | $91,996 | $52,850 | $39,146 |
| 2021 | $1,421 | $86,735 | $50,050 | $36,685 |
| 2020 | $1,377 | $83,999 | $48,300 | $35,699 |
| 2019 | $1,337 | $76,330 | $43,750 | $32,580 |
| 2018 | $1,298 | $73,543 | $42,700 | $30,843 |
| 2017 | $1,917 | $65,372 | $35,000 | $30,372 |
| 2016 | $1,230 | $60,823 | $24,500 | $36,323 |
| 2015 | $1,227 | $61,465 | $24,500 | $36,965 |
| 2014 | $1,191 | $39,390 | $17,500 | $21,890 |
Source: Public Records
Map
Nearby Homes
- 4220 W Pinecrest Cir
- 4202 W Pinecrest Cir
- 4318 Ridgecrest Dr
- 3855 Mayhill Ave
- 3525 Raina Ridge Ct
- 4119 Meadowglen Cir
- 3475 E Rochelle Ave
- 3718 Canary Palm Ct
- 3960 Monthill Ave
- 4501 Woodcrest Rd
- 4041 Radbourne Ave
- 3919 Brighthill Ave
- 3421 Rochelle Ct
- 3430 Tanto Cir
- 4017 Radbourne Ave
- 4485 Greenhill Dr
- 4515 Goen Way
- 3950 S Sandhill Rd Unit 130
- 3950 S Sandhill Rd Unit 103
- 3950 S Sandhill Rd Unit 132
- 4237 E Pinecrest Cir
- 3707 N Rosecrest Cir
- 3689 N Rosecrest Cir
- 4239 W Pinecrest Cir
- 4221 W Pinecrest Cir
- 3671 N Rosecrest Cir
- 3725 N Rosecrest Cir
- 4201 E Pinecrest Cir
- 4203 W Pinecrest Cir
- 4240 Woodcrest Rd
- 4240 E Pinecrest Cir
- 4240 Pinecrest East Cir
- 3653 N Rosecrest Cir
- 4184 W Pinecrest Cir
- 3708 S Rosecrest Cir
- 3743 N Rosecrest Cir
- 4222 Woodcrest Rd
- 4222 E Pinecrest Cir
- 3672 S Rosecrest Cir
- 3672 Rosecrest South Cir