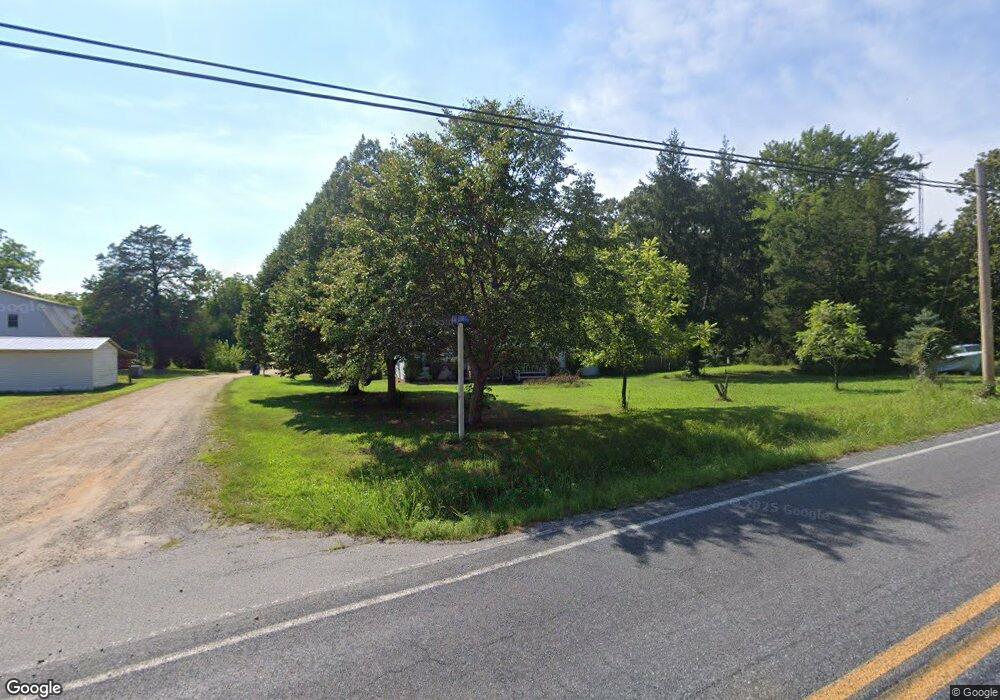
42388 Grayhound Ln Mechanicsville, MD 20659
Estimated Value: $255,000 - $336,000
--
Bed
1
Bath
1,524
Sq Ft
$195/Sq Ft
Est. Value
About This Home
This home is located at 42388 Grayhound Ln, Mechanicsville, MD 20659 and is currently estimated at $297,417, approximately $195 per square foot. 42388 Grayhound Ln is a home located in St. Mary's County with nearby schools including Oakville Elementary School, Leonardtown Middle School, and Chopticon High School.
Ownership History
Date
Name
Owned For
Owner Type
Purchase Details
Closed on
Jun 5, 2009
Sold by
Croson Joe and Croson Elicia Mcclain
Bought by
Croson Joe S and Croson O
Current Estimated Value
Purchase Details
Closed on
Jun 2, 2008
Sold by
Gatton Robert Paul
Bought by
Croson Joe and Croson Elicia Mcclain
Home Financials for this Owner
Home Financials are based on the most recent Mortgage that was taken out on this home.
Original Mortgage
$208,354
Interest Rate
5.94%
Mortgage Type
FHA
Purchase Details
Closed on
May 9, 2008
Sold by
Gatton Robert Paul
Bought by
Croson Joe and Croson Elicia Mcclain
Home Financials for this Owner
Home Financials are based on the most recent Mortgage that was taken out on this home.
Original Mortgage
$208,354
Interest Rate
5.94%
Mortgage Type
FHA
Purchase Details
Closed on
Dec 9, 1997
Sold by
Gatton Robert Paul
Bought by
Gatton Robert Paul and Murphy Judy V
Purchase Details
Closed on
Oct 16, 1996
Sold by
Gatton Elaine Carol
Bought by
Gatton Robert Paul
Create a Home Valuation Report for This Property
The Home Valuation Report is an in-depth analysis detailing your home's value as well as a comparison with similar homes in the area
Home Values in the Area
Average Home Value in this Area
Purchase History
| Date | Buyer | Sale Price | Title Company |
|---|---|---|---|
| Croson Joe S | -- | -- | |
| Croson Joe | $210,000 | -- | |
| Croson Joe | $210,000 | -- | |
| Gatton Robert Paul | -- | -- | |
| Gatton Robert Paul | -- | -- |
Source: Public Records
Mortgage History
| Date | Status | Borrower | Loan Amount |
|---|---|---|---|
| Previous Owner | Croson Joe | $208,354 | |
| Previous Owner | Croson Joe | $208,354 | |
| Closed | Croson Joe S | -- |
Source: Public Records
Tax History Compared to Growth
Tax History
| Year | Tax Paid | Tax Assessment Tax Assessment Total Assessment is a certain percentage of the fair market value that is determined by local assessors to be the total taxable value of land and additions on the property. | Land | Improvement |
|---|---|---|---|---|
| 2025 | $2,374 | $209,700 | $113,100 | $96,600 |
| 2024 | $2,275 | $202,700 | $0 | $0 |
| 2023 | $2,210 | $195,700 | $0 | $0 |
| 2022 | $1,811 | $188,700 | $113,100 | $75,600 |
| 2021 | $176 | $186,500 | $0 | $0 |
| 2020 | $2,075 | $184,300 | $0 | $0 |
| 2019 | $158 | $182,100 | $108,100 | $74,000 |
| 2018 | $151 | $182,100 | $108,100 | $74,000 |
| 2017 | $2,029 | $182,100 | $0 | $0 |
| 2016 | -- | $183,300 | $0 | $0 |
| 2015 | $2,028 | $183,300 | $0 | $0 |
| 2014 | $2,028 | $183,300 | $0 | $0 |
Source: Public Records
Map
Nearby Homes
- 26181 S Sandgates Rd
- 26079 S Sandgates Rd
- 42475 Clover Hill Rd
- 43088 Island View
- 26188 Skyview Dr
- 26914 Bartlett St
- 26221 Skyview Dr
- 26369 Jones Wharf Rd
- 27068 Cape Saint Marys Dr
- 26005 Jones Wharf Rd
- 0 Holly Ln Unit MDSM2023572
- 27086 Holly Ln
- 42173 Ridge Rd
- 0 Cat Creek Rd Unit MDSM2026434
- 25757 Jones Wharf Rd
- 26350 Three Notch Rd
- 43063 Hugh Dr
- 43135 Goldsborough Place
- 43447 Drum Cliff Rd
- 26366 Mar A Lee Ct
- 43288 Grayhound Ln
- 26241 S Sandgates Rd
- 26183 S Sandgates Rd
- 42360 Grayhound Ln
- 26231 S Sandgates Rd
- 42369 Grayhound Ln
- 42356 Grayhound Ln
- 42356 Grayhound Ln Unit 2
- 42349 Grayhound Ln
- 26252 S Sandgates Rd
- 42340 Grayhound Ln
- 26177 S Sandgates Rd
- 26165 S Sandgates Rd
- 42455 Bowling Ln
- 26159 S Sandgates Rd
- 26151 S Sandgates Rd
- 26105 S Sandgates Rd
- 42374 Alan Ln
- 26146 Woody Ct
- 26062 S Sandgates Rd