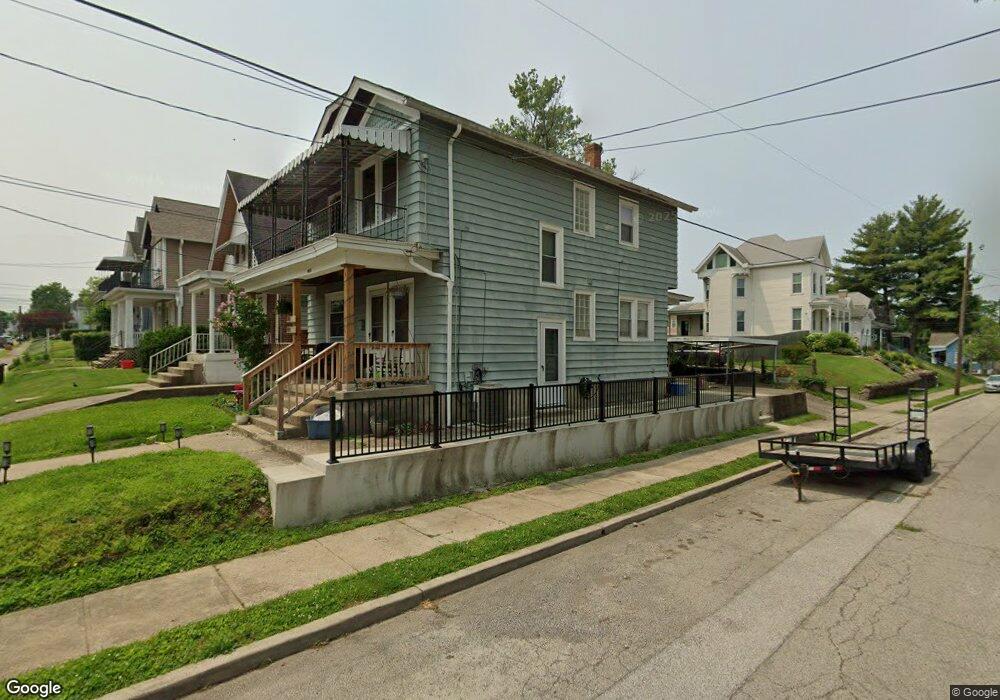
4239 Bell St Cincinnati, OH 45212
Estimated Value: $173,000 - $234,000
2
Beds
2
Baths
1,562
Sq Ft
$132/Sq Ft
Est. Value
About This Home
This home is located at 4239 Bell St, Cincinnati, OH 45212 and is currently estimated at $205,443, approximately $131 per square foot. 4239 Bell St is a home located in Hamilton County with nearby schools including Norwood High School, Cornerstone Christian Academy, and Xavier University Montessori Lab School.
Ownership History
Date
Name
Owned For
Owner Type
Purchase Details
Closed on
Apr 29, 2008
Sold by
Dumont Michael W and Dumont Judith A
Bought by
Dumont Michael F
Current Estimated Value
Purchase Details
Closed on
Jun 30, 1999
Sold by
Dumont James R
Bought by
Dumont Michael F and Dumont Michael W
Home Financials for this Owner
Home Financials are based on the most recent Mortgage that was taken out on this home.
Original Mortgage
$60,838
Outstanding Balance
$15,405
Interest Rate
7.29%
Mortgage Type
FHA
Estimated Equity
$190,038
Create a Home Valuation Report for This Property
The Home Valuation Report is an in-depth analysis detailing your home's value as well as a comparison with similar homes in the area
Home Values in the Area
Average Home Value in this Area
Purchase History
| Date | Buyer | Sale Price | Title Company |
|---|---|---|---|
| Dumont Michael F | -- | None Available | |
| Dumont Michael F | $70,000 | L & D Title Agency Inc |
Source: Public Records
Mortgage History
| Date | Status | Borrower | Loan Amount |
|---|---|---|---|
| Open | Dumont Michael F | $60,838 |
Source: Public Records
Tax History
| Year | Tax Paid | Tax Assessment Tax Assessment Total Assessment is a certain percentage of the fair market value that is determined by local assessors to be the total taxable value of land and additions on the property. | Land | Improvement |
|---|---|---|---|---|
| 2025 | $2,523 | $48,633 | $7,277 | $41,356 |
| 2023 | $2,517 | $48,633 | $7,277 | $41,356 |
| 2022 | $2,009 | $32,568 | $4,890 | $27,678 |
| 2021 | $1,946 | $32,568 | $4,890 | $27,678 |
| 2020 | $1,952 | $32,568 | $4,890 | $27,678 |
| 2019 | $1,854 | $28,568 | $4,288 | $24,280 |
| 2018 | $2,126 | $28,568 | $4,288 | $24,280 |
| 2017 | $1,754 | $28,568 | $4,288 | $24,280 |
| 2016 | $1,645 | $25,890 | $4,032 | $21,858 |
| 2015 | $1,463 | $25,890 | $4,032 | $21,858 |
| 2014 | $1,463 | $25,890 | $4,032 | $21,858 |
| 2013 | $1,539 | $27,542 | $4,288 | $23,254 |
Source: Public Records
Map
Nearby Homes
- 1839 Hopkins Ave
- 1841 Mills Ave
- 1762 Cleveland Ave
- 1816 Cleveland Ave
- 1701 Sherman Ave
- 1931 Waverly Ave
- 2010 Hopkins Ave
- 1901 Sherman Ave
- 1812 Tilden Ave
- 4108 Montgomery Rd
- 1820 Wayland Ave
- 4206 Lafayette Ave
- 4635 Baker St
- 2043 Lawrence Ave
- 3 Baker Cir
- 1819 Maple Ave
- 1827 Maple Ave
- 2049 Sherman Ave
- 1808 Maple Ave
- 4719 Section Ave
Your Personal Tour Guide
Ask me questions while you tour the home.