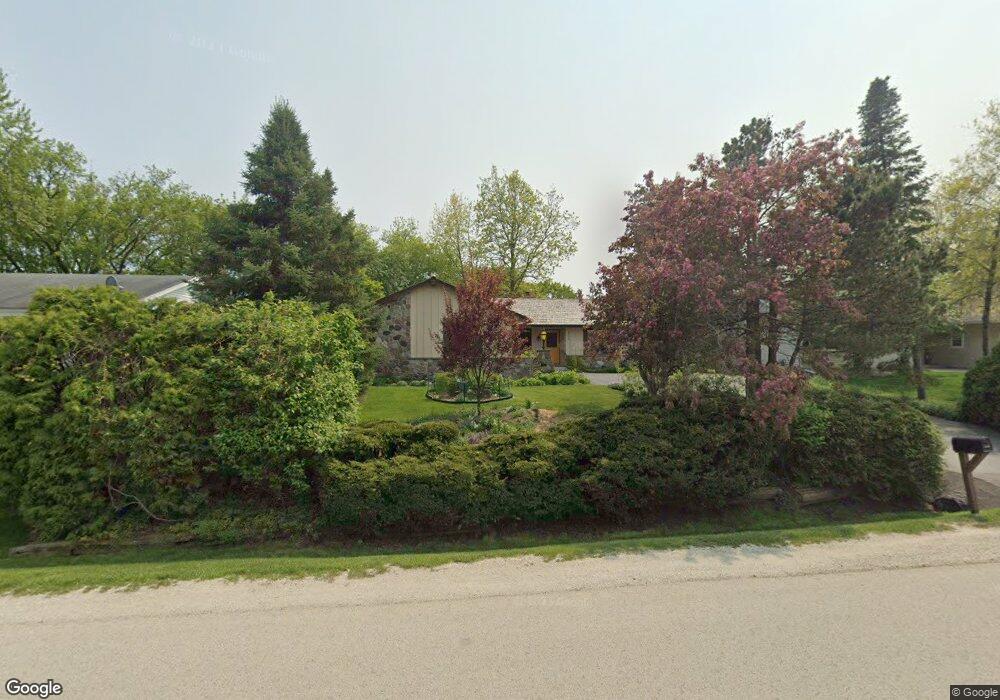
4239 Garden Dr Mount Pleasant, WI 53403
Estimated Value: $292,000 - $336,000
3
Beds
2
Baths
1,318
Sq Ft
$238/Sq Ft
Est. Value
About This Home
This home is located at 4239 Garden Dr, Mount Pleasant, WI 53403 and is currently estimated at $313,535, approximately $237 per square foot. 4239 Garden Dr is a home located in Racine County with nearby schools including Jones Elementary School, Johnson Elementary School, and Mitchell Middle School.
Ownership History
Date
Name
Owned For
Owner Type
Purchase Details
Closed on
Jan 27, 2024
Sold by
Gallion Stephen D and Gallion Stephen
Bought by
Gallion Stephen D
Current Estimated Value
Home Financials for this Owner
Home Financials are based on the most recent Mortgage that was taken out on this home.
Original Mortgage
$485,250
Outstanding Balance
$485,177
Interest Rate
8.23%
Mortgage Type
Credit Line Revolving
Estimated Equity
-$171,642
Purchase Details
Closed on
Sep 4, 2018
Sold by
Gumm Nancy J and Nancy J Gumm Family Trust
Bought by
Gallion Steve and Gallion Stephen D
Purchase Details
Closed on
Mar 21, 2014
Sold by
Gumm Nancy J and Wilbert P Gumm Jr Family Trust
Bought by
Gumm Nancy J and Nancy J Gumm Family Trust
Purchase Details
Closed on
Dec 4, 2007
Sold by
Gumm Wilburt P Jr Fam Trust
Bought by
Gumm Nancy J and Gumm Sub
Create a Home Valuation Report for This Property
The Home Valuation Report is an in-depth analysis detailing your home's value as well as a comparison with similar homes in the area
Home Values in the Area
Average Home Value in this Area
Purchase History
| Date | Buyer | Sale Price | Title Company |
|---|---|---|---|
| Gallion Stephen D | -- | Atlas Title Company | |
| Gallion Steve | $185,000 | Knight Barry Title Inc | |
| Gumm Nancy J | -- | None Available | |
| Gumm Nancy J | $98,950 | -- |
Source: Public Records
Mortgage History
| Date | Status | Borrower | Loan Amount |
|---|---|---|---|
| Open | Gallion Stephen D | $485,250 |
Source: Public Records
Tax History Compared to Growth
Tax History
| Year | Tax Paid | Tax Assessment Tax Assessment Total Assessment is a certain percentage of the fair market value that is determined by local assessors to be the total taxable value of land and additions on the property. | Land | Improvement |
|---|---|---|---|---|
| 2024 | $3,623 | $236,700 | $41,400 | $195,300 |
| 2023 | $3,191 | $205,800 | $38,600 | $167,200 |
| 2022 | $2,702 | $173,000 | $38,600 | $134,400 |
| 2021 | $2,748 | $157,700 | $35,100 | $122,600 |
| 2020 | $2,598 | $142,900 | $28,100 | $114,800 |
| 2019 | $2,837 | $163,100 | $28,100 | $135,000 |
| 2018 | $3,260 | $172,100 | $25,000 | $147,100 |
| 2017 | $3,049 | $157,600 | $25,000 | $132,600 |
| 2016 | $3,009 | $146,900 | $34,500 | $112,400 |
| 2015 | $2,968 | $146,900 | $34,500 | $112,400 |
| 2014 | $2,798 | $146,600 | $34,500 | $112,100 |
| 2013 | $2,984 | $146,600 | $34,500 | $112,100 |
Source: Public Records
Map
Nearby Homes
- 4320 Pine Ridge Ln
- 4244 Pennington Ln
- 3703 Canada Goose Crossing
- 4135 Woodbury Ln
- 4749 Piper Ln
- 3933 Country Ln
- 4218 Meachem Rd
- 3520 Pleasant Ln
- 3738 Warren Cir
- 3324 Foxwood Rd
- 4744 Saint Regis Dr
- 3330 Raymond Ct
- 4620 Taylor Ave
- 3929 Southwood Dr
- 3607 Meachem Rd
- 3331 Green Meadows Ln
- 5740 Foothill Dr
- 2721 Brentwood Dr
- 3403 Oakwood Dr
- 3845 Lakeview Dr
- 4231 Garden Dr
- 4230 Chekanoff Dr
- 4242 Chekanoff Dr
- 4218 Chekanoff Dr
- 4223 Garden Dr
- 4248 Chekanoff Dr
- 4232 Garden Dr
- 4355 Danbury Ln
- 4502 Farmington Ln
- 4315 Garden Dr
- 4300 Chekanoff Dr
- 4314 Garden Dr
- 4347 Danbury Ln
- 4229 Chekanoff Dr
- 4241 Chekanoff Dr
- 4348 Farmington Ln
- 4308 Chekanoff Dr
- 4321 Garden Dr
- 4217 Chekanoff Dr
- 4247 Chekanoff Dr