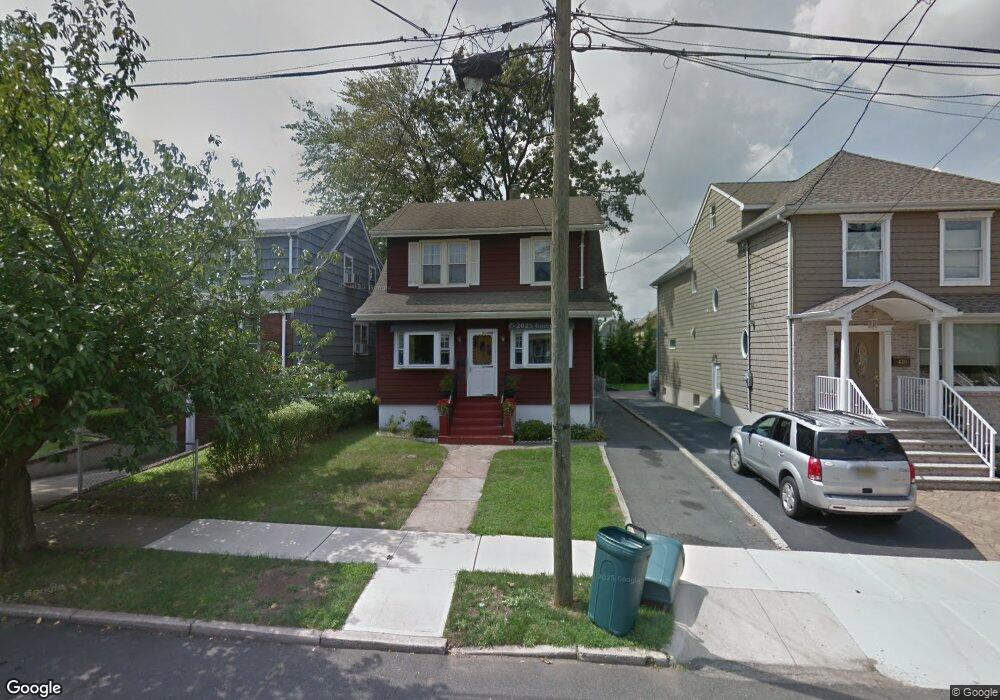
424 3rd Ave Lyndhurst, NJ 07071
Estimated Value: $542,000 - $628,000
Studio
--
Bath
1,228
Sq Ft
$467/Sq Ft
Est. Value
About This Home
This home is located at 424 3rd Ave, Lyndhurst, NJ 07071 and is currently estimated at $573,163, approximately $466 per square foot. 424 3rd Ave is a home located in Bergen County with nearby schools including Lyndhurst High School and Sacred Heart School.
Ownership History
Date
Name
Owned For
Owner Type
Purchase Details
Closed on
May 5, 2011
Sold by
Mcfadden Nancy M and Mcfadden Richard S
Bought by
Copell James and Monaco Jessica
Current Estimated Value
Home Financials for this Owner
Home Financials are based on the most recent Mortgage that was taken out on this home.
Original Mortgage
$266,640
Outstanding Balance
$184,189
Interest Rate
4.75%
Mortgage Type
FHA
Estimated Equity
$388,974
Create a Home Valuation Report for This Property
The Home Valuation Report is an in-depth analysis detailing your home's value as well as a comparison with similar homes in the area
Home Values in the Area
Average Home Value in this Area
Purchase History
| Date | Buyer | Sale Price | Title Company |
|---|---|---|---|
| Copell James | $274,000 | -- |
Source: Public Records
Mortgage History
| Date | Status | Borrower | Loan Amount |
|---|---|---|---|
| Open | Copell James | $266,640 |
Source: Public Records
Tax History
| Year | Tax Paid | Tax Assessment Tax Assessment Total Assessment is a certain percentage of the fair market value that is determined by local assessors to be the total taxable value of land and additions on the property. | Land | Improvement |
|---|---|---|---|---|
| 2025 | $8,023 | $388,200 | $244,500 | $143,700 |
| 2024 | $7,722 | $384,600 | $242,500 | $142,100 |
| 2023 | $7,537 | $380,000 | $239,500 | $140,500 |
| 2022 | $7,537 | $237,600 | $145,000 | $92,600 |
| 2021 | $7,223 | $237,600 | $145,000 | $92,600 |
| 2020 | $7,066 | $237,600 | $145,000 | $92,600 |
| 2019 | $7,014 | $237,600 | $145,000 | $92,600 |
| 2018 | $7,071 | $237,600 | $145,000 | $92,600 |
| 2017 | $6,893 | $237,600 | $145,000 | $92,600 |
| 2016 | $6,738 | $237,600 | $145,000 | $92,600 |
| 2015 | $6,527 | $237,600 | $145,000 | $92,600 |
| 2014 | $6,441 | $237,600 | $145,000 | $92,600 |
Source: Public Records
Map
Nearby Homes
- 54 Stuyvesant Ave
- 232 Stuyvesant Ave
- 249 Court Ave Unit 51
- 539 Freeman St
- 245 Court Ave Unit 7
- 135 Jay Ave
- 252 Oriental Place
- 631 6th Ave
- 317 Ridge Rd
- 271 Travers Place
- 36 Kearney St
- 34 Kearney St
- 220 Webster Ave
- 648 Milton Ave
- 112 Rutherford Ave
- 121 Woodland Ave
- 217 Mountain Way
- 11 W Gouverneur Ave
- 319 Ridge Rd
- 167 Valley Brook Ave
Your Personal Tour Guide
Ask me questions while you tour the home.