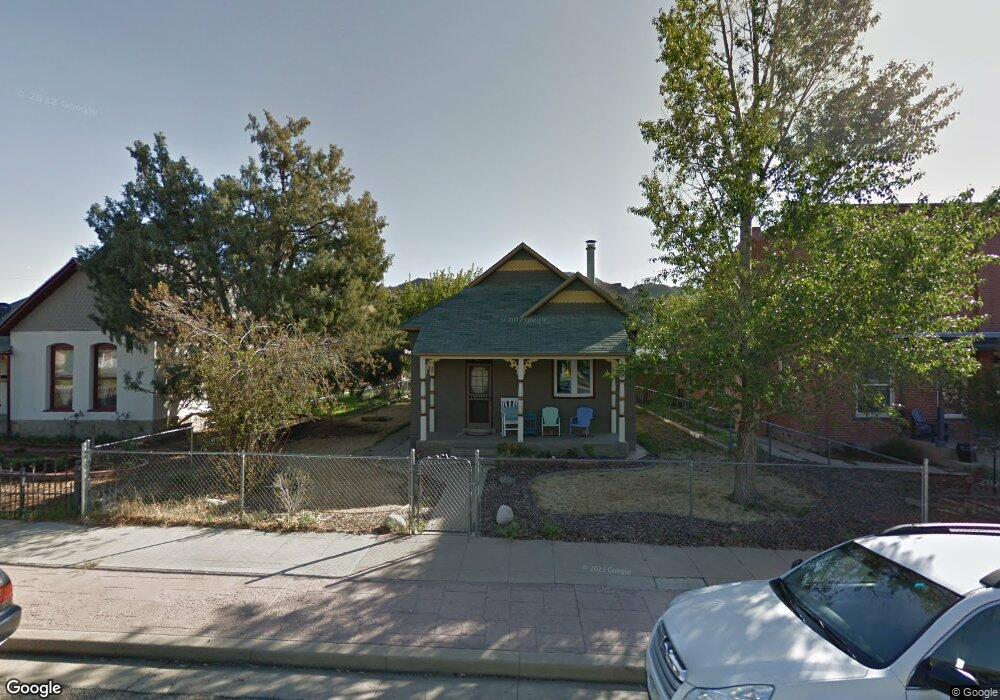
424 E 3rd St Salida, CO 81201
Estimated Value: $715,738 - $833,000
3
Beds
2
Baths
1,440
Sq Ft
$542/Sq Ft
Est. Value
About This Home
This home is located at 424 E 3rd St, Salida, CO 81201 and is currently estimated at $781,185, approximately $542 per square foot. 424 E 3rd St is a home located in Chaffee County with nearby schools including Longfellow Elementary School, Salida Middle School, and Horizons Exploratory Academy.
Ownership History
Date
Name
Owned For
Owner Type
Purchase Details
Closed on
Dec 10, 2018
Sold by
Lunt William W and Lunt Mae Iyn
Bought by
Lunt 2018 Trust
Current Estimated Value
Purchase Details
Closed on
Oct 16, 2014
Sold by
Chambers Darrell W and Chambers Kathy A
Bought by
Lunt Willaim W and Lunt Mae Lyn
Home Financials for this Owner
Home Financials are based on the most recent Mortgage that was taken out on this home.
Original Mortgage
$182,000
Outstanding Balance
$56,860
Interest Rate
4.25%
Mortgage Type
New Conventional
Estimated Equity
$724,325
Purchase Details
Closed on
Aug 11, 2006
Sold by
Price Bradford K and Price Beatrice M
Bought by
Chambers Darrell W and Chambers Kathy A
Home Financials for this Owner
Home Financials are based on the most recent Mortgage that was taken out on this home.
Original Mortgage
$100,000
Interest Rate
6.75%
Mortgage Type
New Conventional
Create a Home Valuation Report for This Property
The Home Valuation Report is an in-depth analysis detailing your home's value as well as a comparison with similar homes in the area
Home Values in the Area
Average Home Value in this Area
Purchase History
| Date | Buyer | Sale Price | Title Company |
|---|---|---|---|
| Lunt 2018 Trust | -- | None Available | |
| Lunt Willaim W | $332,000 | None Available | |
| Chambers Darrell W | $250,000 | -- |
Source: Public Records
Mortgage History
| Date | Status | Borrower | Loan Amount |
|---|---|---|---|
| Open | Lunt Willaim W | $182,000 | |
| Previous Owner | Chambers Darrell W | $100,000 |
Source: Public Records
Tax History
| Year | Tax Paid | Tax Assessment Tax Assessment Total Assessment is a certain percentage of the fair market value that is determined by local assessors to be the total taxable value of land and additions on the property. | Land | Improvement |
|---|---|---|---|---|
| 2025 | $2,188 | $38,920 | $14,080 | $24,840 |
| 2024 | $2,188 | $48,570 | $15,100 | $33,470 |
| 2023 | $2,116 | $48,570 | $15,100 | $33,470 |
| 2022 | $1,449 | $30,390 | $12,350 | $18,040 |
| 2021 | $1,454 | $31,270 | $12,710 | $18,560 |
| 2020 | $1,378 | $28,150 | $6,220 | $21,930 |
| 2019 | $1,380 | $28,150 | $6,220 | $21,930 |
| 2018 | $1,058 | $21,880 | $6,440 | $15,440 |
| 2017 | $1,031 | $21,880 | $6,440 | $15,440 |
| 2016 | $991 | $20,590 | $6,320 | $14,270 |
| 2015 | $843 | $20,590 | $6,320 | $14,270 |
| 2014 | $843 | $16,690 | $6,360 | $10,330 |
Source: Public Records
Map
Nearby Homes
- 239 E St
- 144 N C St
- 317 E 4th St
- 402 E Sackett Ave Unit D
- 536 E 1st St Unit J
- 536 E 1st St Unit C
- 330 E St
- 225 F St Unit C
- 225 F St Unit C
- 243 Park Ave
- 207 F St Unit 2
- 235 E 5th St
- 332 F St
- 212 Blake St
- 0 N F Street D1
- 204 N F St Unit C-2
- 204 N F St Unit 206
- 204 N F St Unit D1/301
- 129 W Sackett Ave Unit I
- 129 W Sackett Ave Unit F
Your Personal Tour Guide
Ask me questions while you tour the home.