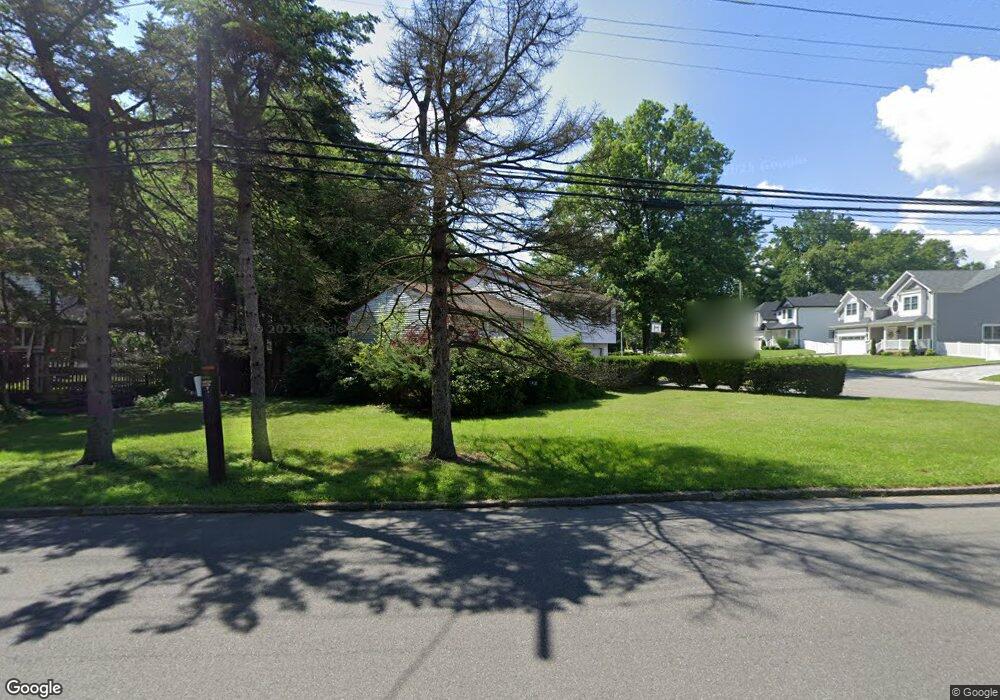
424 Grant Ave Cresskill, NJ 07626
Estimated Value: $891,000 - $1,003,000
3
Beds
2
Baths
1,492
Sq Ft
$640/Sq Ft
Est. Value
About This Home
This home is located at 424 Grant Ave, Cresskill, NJ 07626 and is currently estimated at $954,963, approximately $640 per square foot. 424 Grant Ave is a home located in Bergen County with nearby schools including Cresskill High School.
Ownership History
Date
Name
Owned For
Owner Type
Purchase Details
Closed on
Jun 6, 2018
Sold by
Limor Sora and Antonov Andrei
Bought by
Lee Ju H and Lee Kyungsook
Current Estimated Value
Purchase Details
Closed on
Oct 5, 2000
Sold by
Kedem Rachel
Bought by
Limor Sora and Antonov Andrei
Home Financials for this Owner
Home Financials are based on the most recent Mortgage that was taken out on this home.
Original Mortgage
$252,700
Interest Rate
7.88%
Create a Home Valuation Report for This Property
The Home Valuation Report is an in-depth analysis detailing your home's value as well as a comparison with similar homes in the area
Home Values in the Area
Average Home Value in this Area
Purchase History
| Date | Buyer | Sale Price | Title Company |
|---|---|---|---|
| Lee Ju H | $575,000 | -- | |
| Limor Sora | $353,000 | -- |
Source: Public Records
Mortgage History
| Date | Status | Borrower | Loan Amount |
|---|---|---|---|
| Previous Owner | Limor Sora | $252,700 |
Source: Public Records
Tax History Compared to Growth
Tax History
| Year | Tax Paid | Tax Assessment Tax Assessment Total Assessment is a certain percentage of the fair market value that is determined by local assessors to be the total taxable value of land and additions on the property. | Land | Improvement |
|---|---|---|---|---|
| 2025 | $14,069 | $648,700 | $422,300 | $226,400 |
| 2024 | $13,673 | $611,700 | $377,400 | $234,300 |
| 2023 | $13,342 | $589,100 | $360,700 | $228,400 |
| 2022 | $13,342 | $554,300 | $334,500 | $219,800 |
| 2021 | $13,216 | $541,200 | $327,300 | $213,900 |
| 2020 | $12,882 | $529,700 | $319,300 | $210,400 |
| 2019 | $12,584 | $522,800 | $315,900 | $206,900 |
| 2018 | $7,902 | $468,700 | $313,100 | $155,600 |
| 2017 | $11,868 | $436,000 | $241,700 | $194,300 |
| 2016 | $11,515 | $436,000 | $241,700 | $194,300 |
| 2015 | $11,157 | $436,000 | $241,700 | $194,300 |
| 2014 | $10,822 | $436,000 | $241,700 | $194,300 |
Source: Public Records
Map
Nearby Homes