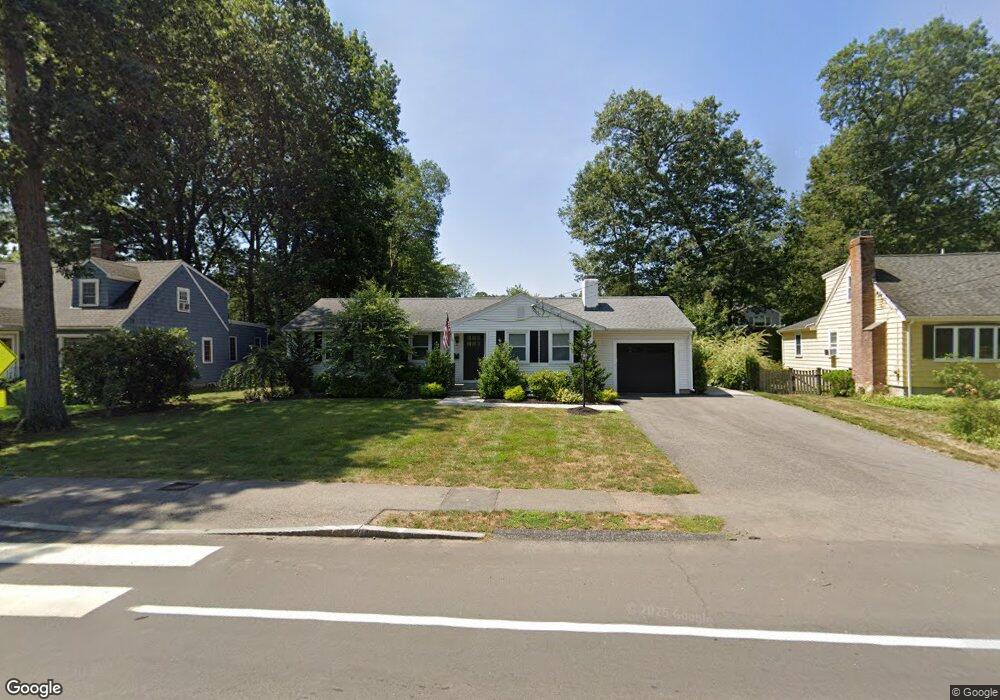
424 High Rock St Needham, MA 02492
Estimated Value: $1,299,000 - $1,603,000
4
Beds
3
Baths
2,030
Sq Ft
$731/Sq Ft
Est. Value
About This Home
This home is located at 424 High Rock St, Needham, MA 02492 and is currently estimated at $1,483,237, approximately $730 per square foot. 424 High Rock St is a home located in Norfolk County with nearby schools including Newman Elementary School, High Rock Middle School, and Pollard Middle School.
Ownership History
Date
Name
Owned For
Owner Type
Purchase Details
Closed on
Nov 30, 2007
Sold by
Barry James F and Shiebler Mary A
Bought by
Barry Catherine C
Current Estimated Value
Home Financials for this Owner
Home Financials are based on the most recent Mortgage that was taken out on this home.
Original Mortgage
$265,000
Interest Rate
6.48%
Mortgage Type
Purchase Money Mortgage
Create a Home Valuation Report for This Property
The Home Valuation Report is an in-depth analysis detailing your home's value as well as a comparison with similar homes in the area
Home Values in the Area
Average Home Value in this Area
Purchase History
| Date | Buyer | Sale Price | Title Company |
|---|---|---|---|
| Barry Catherine C | -- | -- | |
| Pinti Richard M | $395,000 | -- | |
| Barry Catherine C | -- | -- |
Source: Public Records
Mortgage History
| Date | Status | Borrower | Loan Amount |
|---|---|---|---|
| Open | Barry Catherine C | $255,000 | |
| Closed | Pinti Richard M | $265,000 | |
| Closed | Barry Catherine C | $0 |
Source: Public Records
Tax History
| Year | Tax Paid | Tax Assessment Tax Assessment Total Assessment is a certain percentage of the fair market value that is determined by local assessors to be the total taxable value of land and additions on the property. | Land | Improvement |
|---|---|---|---|---|
| 2025 | $13,302 | $1,254,900 | $797,200 | $457,700 |
| 2024 | $10,956 | $875,100 | $454,100 | $421,000 |
| 2023 | $10,995 | $843,200 | $454,100 | $389,100 |
| 2022 | $10,557 | $789,600 | $416,700 | $372,900 |
| 2021 | $10,288 | $789,600 | $416,700 | $372,900 |
| 2020 | $10,149 | $812,600 | $416,600 | $396,000 |
| 2019 | $9,493 | $766,200 | $378,700 | $387,500 |
| 2018 | $9,102 | $766,200 | $378,700 | $387,500 |
| 2017 | $6,022 | $506,500 | $378,700 | $127,800 |
| 2016 | $5,866 | $508,300 | $378,700 | $129,600 |
| 2015 | $5,739 | $508,300 | $378,700 | $129,600 |
| 2014 | $5,294 | $454,800 | $329,300 | $125,500 |
Source: Public Records
Map
Nearby Homes
- 95 Deerfield Rd
- 287 High Rock St
- 620 High Rock St
- 189 Bridle Trail Rd
- 73 Maple St Unit 1
- 47 Emerson Rd
- 569 Chestnut St
- 90 Norfolk St
- 52 Hancock Rd
- 193 Garden St
- 233 Warren St
- 957 South St
- 150 Laurel Dr
- 37 Carleton Dr
- 68 Pleasant St Unit 68
- 34 Stratford Rd
- 3 Hancock Rd
- 1011 Webster St
- 8 Crestview Rd
- 19 Highland Ct Unit 19
- 430 High Rock St
- 418 High Rock St
- 80 Barrett St
- 74 Barrett St
- 86 Barrett St
- 6 Frances St
- 410 High Rock St
- 24 Birchwood Rd
- 431 High Rock St
- 92 Barrett St
- 18 Frances St
- 404 High Rock St
- 407 High Rock St
- 437 High Rock St
- 16 Birchwood Rd
- 100 Barrett St
- 79 Barrett St
- 3 Frances St
- 15 Birchwood Rd
- 87 Barrett St
Your Personal Tour Guide
Ask me questions while you tour the home.