424 High St North Attleboro, MA 02760
North Attleboro NeighborhoodEstimated Value: $471,000 - $540,730
2
Beds
1
Bath
1,458
Sq Ft
$351/Sq Ft
Est. Value
About This Home
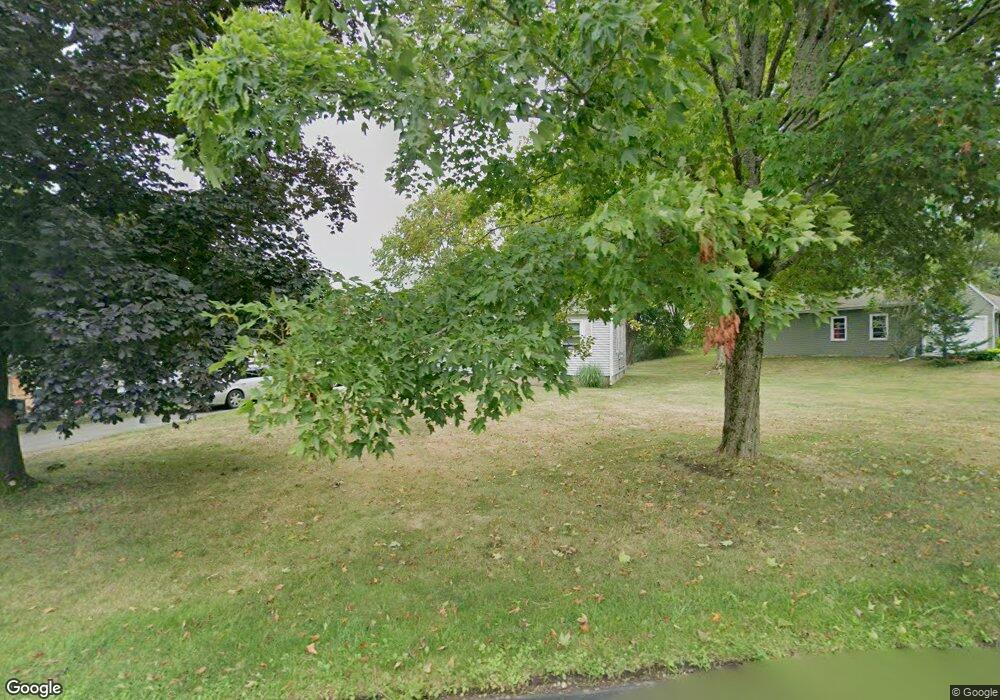
This home is located at 424 High St, North Attleboro, MA 02760 and is currently estimated at $511,933, approximately $351 per square foot. 424 High St is a home located in Bristol County with nearby schools including North Attleboro High School.
Ownership History
Date
Name
Owned For
Owner Type
Purchase Details
Closed on
Aug 21, 2017
Sold by
Bowman Stephen J
Bought by
Belham Erin L
Current Estimated Value
Home Financials for this Owner
Home Financials are based on the most recent Mortgage that was taken out on this home.
Original Mortgage
$266,000
Outstanding Balance
$221,956
Interest Rate
3.96%
Mortgage Type
New Conventional
Estimated Equity
$289,977
Purchase Details
Closed on
Apr 29, 2016
Sold by
Joseph W Reid Irt
Bought by
Bowman Stephen J
Create a Home Valuation Report for This Property
The Home Valuation Report is an in-depth analysis detailing your home's value as well as a comparison with similar homes in the area
Home Values in the Area
Average Home Value in this Area
Purchase History
| Date | Buyer | Sale Price | Title Company |
|---|---|---|---|
| Belham Erin L | $280,000 | -- | |
| Bowman Stephen J | -- | -- | |
| Joseph W Reid Irt | -- | -- |
Source: Public Records
Mortgage History
| Date | Status | Borrower | Loan Amount |
|---|---|---|---|
| Open | Belham Erin L | $266,000 |
Source: Public Records
Tax History Compared to Growth
Tax History
| Year | Tax Paid | Tax Assessment Tax Assessment Total Assessment is a certain percentage of the fair market value that is determined by local assessors to be the total taxable value of land and additions on the property. | Land | Improvement |
|---|---|---|---|---|
| 2025 | $5,456 | $462,800 | $138,100 | $324,700 |
| 2024 | $5,163 | $447,400 | $138,100 | $309,300 |
| 2023 | $5,057 | $395,400 | $138,100 | $257,300 |
| 2022 | $4,650 | $333,800 | $138,100 | $195,700 |
| 2021 | $4,509 | $316,000 | $138,100 | $177,900 |
| 2020 | $4,258 | $296,700 | $138,100 | $158,600 |
| 2019 | $4,046 | $284,100 | $125,500 | $158,600 |
| 2018 | $3,570 | $267,600 | $125,500 | $142,100 |
| 2017 | $3,446 | $260,700 | $125,500 | $135,200 |
| 2016 | $3,361 | $254,200 | $139,600 | $114,600 |
| 2015 | $3,305 | $251,500 | $146,600 | $104,900 |
| 2014 | $3,164 | $239,000 | $135,400 | $103,600 |
Source: Public Records
Map
Nearby Homes
- 12 Morgan Way
- 99 Arnold Rd
- 16 Johnson St
- 12 Roosevelt Ave
- 60 Crescent Ave
- 16 Elizabeth St
- 145 W Bacon St
- 20 South St
- 85 Richards Ave
- 93 Bank St
- 160 Crescent Ave
- 151 Roosevelt Ave Unit A
- 19 Church St Unit A5
- 19 Metcalf Cir
- 16 Richards Ave Unit 106
- 105 W Bacon St
- 80 Broadway Unit 9
- 45 Moran St
- 5 Farm Hill Ln
- 33 Ash St
- 32 Eagle Dr
- 440 High St
- 414 High St Morgan Way Lot 1
- 414 High Morgan Way
- 414 High St Morgan Waylot 2
- 414 High Morgan Lot
- 414 High St Morgan Rd Lot 1
- 414 High Morgan Lot 45
- 414 High Sable Way Unit 16
- 414 High St Unit 45
- 414 High St
- 12 Morgan Way Unit 1
- 441 High St
- 414 High St Lot 3
- 414 High Street Morgan
- 414 High St Morgan Rd
- 414 High Street Caspian Unit 27
- 414 High Street Caspian Unit 33
- 414 High Street Caspian Unit 28
- 414 High Caspian Way Unit 11