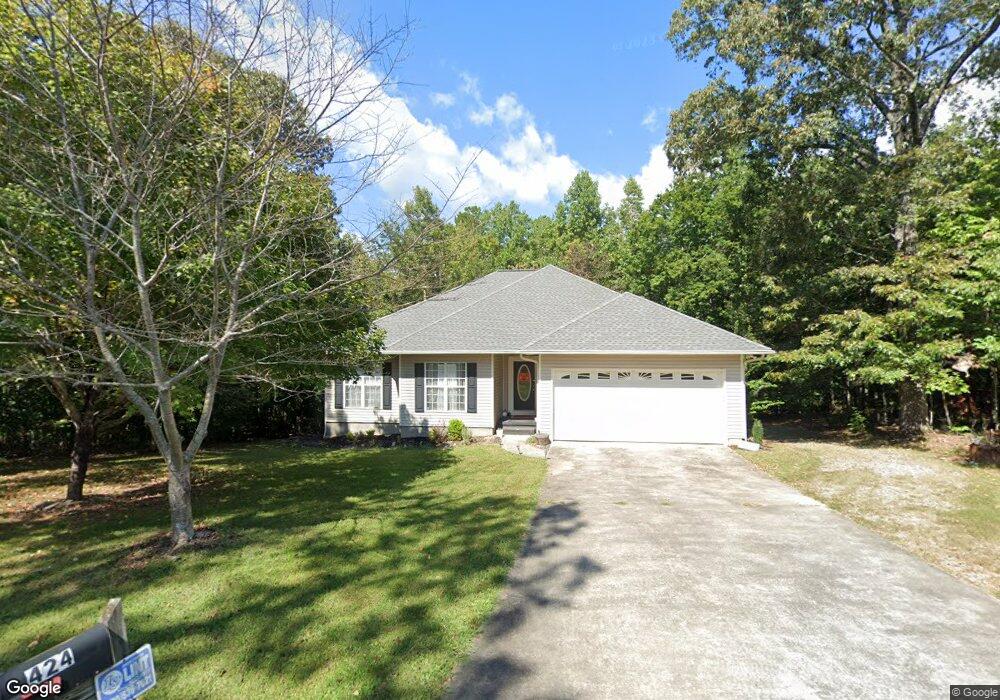
424 Long Branch Crossing Unit 30 Dahlonega, GA 30533
Estimated Value: $415,000 - $563,000
3
Beds
3
Baths
2,572
Sq Ft
$187/Sq Ft
Est. Value
About This Home
This home is located at 424 Long Branch Crossing Unit 30, Dahlonega, GA 30533 and is currently estimated at $481,492, approximately $187 per square foot. 424 Long Branch Crossing Unit 30 is a home located in Lumpkin County with nearby schools including Clay County Middle School and Lumpkin County High School.
Ownership History
Date
Name
Owned For
Owner Type
Purchase Details
Closed on
Dec 16, 2020
Sold by
Cook Brenda Gail
Bought by
Cook Brenda Gail and Reid Chelsea N
Current Estimated Value
Home Financials for this Owner
Home Financials are based on the most recent Mortgage that was taken out on this home.
Original Mortgage
$68,000
Outstanding Balance
$47,741
Interest Rate
2.7%
Mortgage Type
New Conventional
Estimated Equity
$433,751
Purchase Details
Closed on
Mar 29, 2019
Sold by
Melton Kim I
Bought by
Cook Brenda Gail
Home Financials for this Owner
Home Financials are based on the most recent Mortgage that was taken out on this home.
Original Mortgage
$189,500
Interest Rate
4.3%
Mortgage Type
New Conventional
Purchase Details
Closed on
May 29, 1998
Sold by
Fleming Joe
Bought by
Melton Kim I
Purchase Details
Closed on
May 8, 1997
Sold by
Anderson Hayward Eta
Bought by
Fleming Joe
Purchase Details
Closed on
Apr 6, 1996
Bought by
Anderson Hayward Eta
Create a Home Valuation Report for This Property
The Home Valuation Report is an in-depth analysis detailing your home's value as well as a comparison with similar homes in the area
Home Values in the Area
Average Home Value in this Area
Purchase History
| Date | Buyer | Sale Price | Title Company |
|---|---|---|---|
| Cook Brenda Gail | -- | -- | |
| Cook Brenda Gail | $239,500 | -- | |
| Melton Kim I | $145,000 | -- | |
| Fleming Joe | $16,500 | -- | |
| Anderson Hayward Eta | -- | -- |
Source: Public Records
Mortgage History
| Date | Status | Borrower | Loan Amount |
|---|---|---|---|
| Open | Cook Brenda Gail | $68,000 | |
| Previous Owner | Cook Brenda Gail | $189,500 |
Source: Public Records
Tax History Compared to Growth
Tax History
| Year | Tax Paid | Tax Assessment Tax Assessment Total Assessment is a certain percentage of the fair market value that is determined by local assessors to be the total taxable value of land and additions on the property. | Land | Improvement |
|---|---|---|---|---|
| 2024 | $2,984 | $127,362 | $12,000 | $115,362 |
| 2023 | $2,846 | $120,997 | $12,000 | $108,997 |
| 2022 | $2,719 | $109,840 | $12,000 | $97,840 |
| 2021 | $287 | $96,546 | $12,000 | $84,546 |
| 2020 | $232 | $90,782 | $8,032 | $82,750 |
| 2019 | $2,364 | $90,782 | $8,032 | $82,750 |
| 2018 | $1,946 | $70,574 | $8,032 | $62,542 |
| 2017 | $1,906 | $67,900 | $8,032 | $59,868 |
| 2016 | $1,842 | $63,588 | $8,032 | $55,556 |
| 2015 | $1,660 | $63,588 | $8,032 | $55,556 |
| 2014 | $1,660 | $64,959 | $8,032 | $56,927 |
| 2013 | -- | $65,645 | $8,032 | $57,613 |
Source: Public Records
Map
Nearby Homes
- 128 Young Deer Dr
- 87 Tolleffs Trail
- 380 Copper Mill Rd
- 202 Indian Trail
- 0 Arborwood Dr Unit 10645890
- 83 Austin Ct
- 6480 Highway 52 W
- 260 Holly Ln
- 0 Bearden Rd Unit 10598024
- 0 Bearden Rd Unit 7642996
- 100 Rocky Branch Dr
- 600 Chapman Ridge Ln
- 500 Chapman Ridge Ln
- 27.68 Chapman Ridge Ln
- 94 King Arthur Ct
- 1228 Winters Mountain Rd
- 300 Mountain Ridge Dr
- 424 Long Branch Crossing
- 0 Wildwood Ln Unit 5 & 7 8427998
- 0 Wildwood Ln Unit 6050125
- 0 Wildwood Ln Unit 52 53 8402129
- 0 Wildwood Ln Unit 12 7131021
- 0 Wildwood Ln Unit 8 7130996
- 0 Wildwood Ln Unit 3 7130979
- 0 Wildwood Ln Unit LOT 28 7141479
- 0 Wildwood Ln Unit LOT 11 7156123
- 0 Wildwood Ln Unit LOT 9 7156110
- 0 Wildwood Ln Unit LOT 6 7156077
- 0 Wildwood Ln Unit LOT 13 7174227
- 0 Wildwood Ln Unit LOT 28 7355503
- 0 Wildwood Ln Unit 2 7357092
- 0 Wildwood Ln Unit 3003357
- 14 Wildwood Ln Unit 15
- 425 Long Branch Crossing
- 440 Long Branch Crossing
- 24 Wildwood Ln Unit 25
- 368 Long Branch Crossing