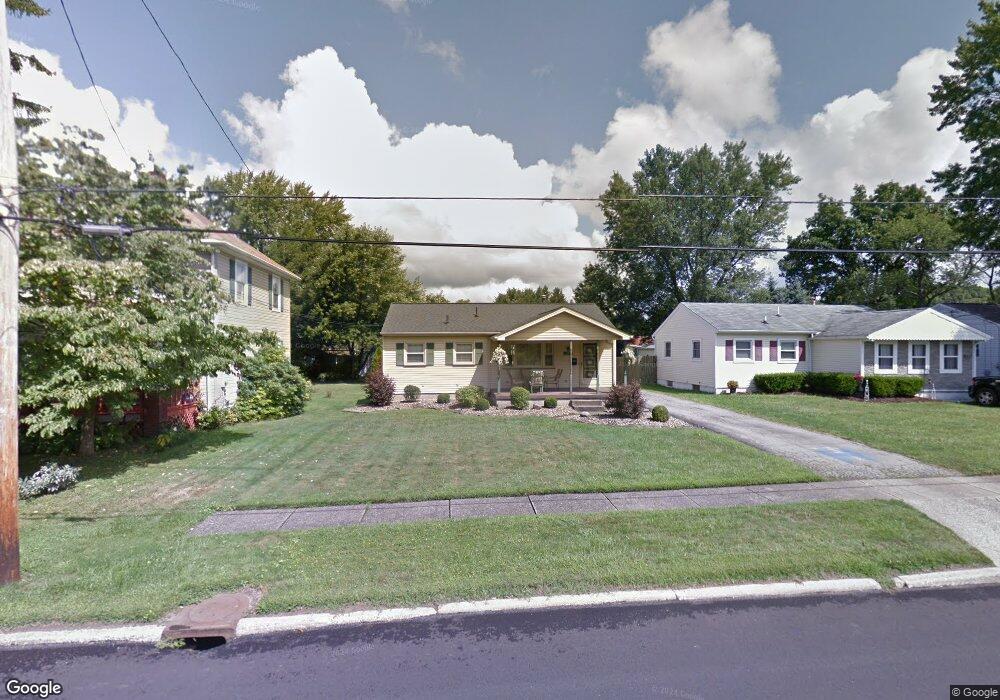
424 Moore St Hubbard, OH 44425
Estimated Value: $143,000 - $160,000
3
Beds
1
Bath
1,032
Sq Ft
$149/Sq Ft
Est. Value
About This Home
This home is located at 424 Moore St, Hubbard, OH 44425 and is currently estimated at $154,243, approximately $149 per square foot. 424 Moore St is a home located in Trumbull County with nearby schools including Hubbard Elementary School, Hubbard Middle School, and Hubbard High School.
Ownership History
Date
Name
Owned For
Owner Type
Purchase Details
Closed on
Jun 11, 2003
Sold by
Madeline Edward J and Madeline Constance
Bought by
Madeline John and Madeline Debbi
Current Estimated Value
Home Financials for this Owner
Home Financials are based on the most recent Mortgage that was taken out on this home.
Original Mortgage
$96,962
Outstanding Balance
$42,474
Interest Rate
5.78%
Mortgage Type
New Conventional
Estimated Equity
$111,769
Purchase Details
Closed on
Jan 1, 1990
Bought by
Edward J Madeline
Create a Home Valuation Report for This Property
The Home Valuation Report is an in-depth analysis detailing your home's value as well as a comparison with similar homes in the area
Home Values in the Area
Average Home Value in this Area
Purchase History
| Date | Buyer | Sale Price | Title Company |
|---|---|---|---|
| Madeline John | $94,000 | -- | |
| Edward J Madeline | -- | -- |
Source: Public Records
Mortgage History
| Date | Status | Borrower | Loan Amount |
|---|---|---|---|
| Open | Madeline John | $96,962 |
Source: Public Records
Tax History
| Year | Tax Paid | Tax Assessment Tax Assessment Total Assessment is a certain percentage of the fair market value that is determined by local assessors to be the total taxable value of land and additions on the property. | Land | Improvement |
|---|---|---|---|---|
| 2024 | $2,155 | $44,140 | $5,110 | $39,030 |
| 2023 | $2,155 | $44,140 | $5,110 | $39,030 |
| 2022 | $1,504 | $28,080 | $4,590 | $23,490 |
| 2021 | $1,511 | $28,080 | $4,590 | $23,490 |
| 2020 | $1,518 | $28,080 | $4,590 | $23,490 |
| 2019 | $1,431 | $25,380 | $4,590 | $20,790 |
| 2018 | $1,426 | $25,380 | $4,590 | $20,790 |
| 2017 | $1,422 | $25,380 | $4,590 | $20,790 |
| 2016 | $1,245 | $23,630 | $4,590 | $19,040 |
| 2015 | $1,250 | $23,630 | $4,590 | $19,040 |
| 2014 | $1,222 | $23,630 | $4,590 | $19,040 |
| 2013 | $1,219 | $23,630 | $4,590 | $19,040 |
Source: Public Records
Map
Nearby Homes
- 764 Jones St
- 784 Elmwood Dr
- 868 Saul Dr
- 228 Stewart St
- 114 Oakdale Ave
- 132 Drummond Ave
- 1145 Doris Dr
- 327 W Park Ave
- 365 Scott St
- 836 School St
- 2974 Schotten Rd
- 601 Wendemere Dr
- 269 Westview Ave
- 585 Creekside Dr
- 229 Jacobs Rd
- 665 Wendemere Dr
- 366 Westview Ave
- 1952 Hubbard Masury Rd
- 7058 Pine Grove Dr
- 5950 Mount Everett Rd
Your Personal Tour Guide
Ask me questions while you tour the home.