Estimated Value: $43,466 - $153,000
2
Beds
1
Bath
858
Sq Ft
$102/Sq Ft
Est. Value
About This Home
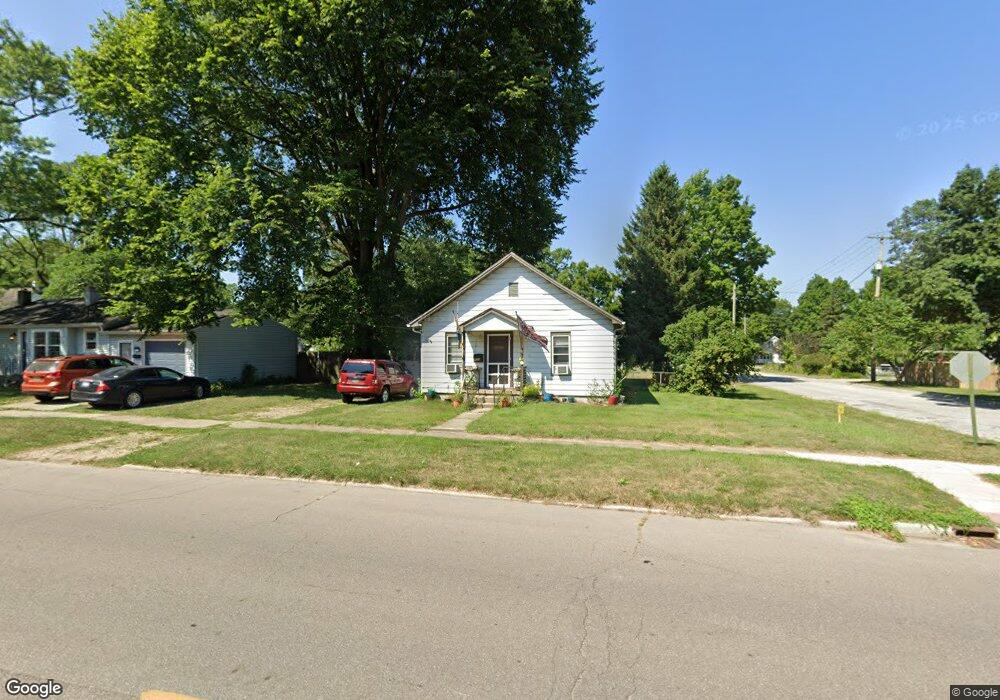
This home is located at 424 N 13th St, Niles, MI 49120 and is currently estimated at $87,867, approximately $102 per square foot. 424 N 13th St is a home located in Berrien County with nearby schools including Ballard Elementary School, Ring Lardner Middle School, and Oak Manor Sixth Grade Center.
Ownership History
Date
Name
Owned For
Owner Type
Purchase Details
Closed on
Aug 25, 2025
Sold by
Io Enterprise Llc
Bought by
Olympia Residence Llc
Current Estimated Value
Purchase Details
Closed on
Jun 3, 2004
Sold by
Horner Floyd and Horner Donna
Bought by
I O Enterprise Llc
Home Financials for this Owner
Home Financials are based on the most recent Mortgage that was taken out on this home.
Original Mortgage
$36,900
Interest Rate
6.17%
Mortgage Type
Unknown
Purchase Details
Closed on
Jan 22, 2002
Purchase Details
Closed on
Jun 11, 1982
Purchase Details
Closed on
Jun 8, 1974
Create a Home Valuation Report for This Property
The Home Valuation Report is an in-depth analysis detailing your home's value as well as a comparison with similar homes in the area
Home Values in the Area
Average Home Value in this Area
Purchase History
| Date | Buyer | Sale Price | Title Company |
|---|---|---|---|
| Olympia Residence Llc | $43,000 | Chicago Title Insurance Compan | |
| Olympia Residence Llc | $43,000 | Chicago Title Insurance Compan | |
| I O Enterprise Llc | -- | Meridian Title Corp | |
| Horner Floyd | $41,000 | Meridian Title Corp | |
| -- | $24,000 | -- | |
| -- | $7,800 | -- | |
| -- | $7,800 | -- |
Source: Public Records
Mortgage History
| Date | Status | Borrower | Loan Amount |
|---|---|---|---|
| Previous Owner | Horner Floyd | $36,900 |
Source: Public Records
Tax History
| Year | Tax Paid | Tax Assessment Tax Assessment Total Assessment is a certain percentage of the fair market value that is determined by local assessors to be the total taxable value of land and additions on the property. | Land | Improvement |
|---|---|---|---|---|
| 2025 | $1,284 | $43,800 | $0 | $0 |
| 2024 | $673 | $38,600 | $0 | $0 |
| 2023 | $645 | $30,000 | $0 | $0 |
| 2022 | $614 | $23,800 | $0 | $0 |
| 2021 | $1,123 | $21,900 | $3,100 | $18,800 |
| 2020 | $1,110 | $20,100 | $0 | $0 |
| 2019 | $1,094 | $19,300 | $2,000 | $17,300 |
| 2018 | $1,147 | $19,300 | $0 | $0 |
| 2017 | $1,211 | $23,300 | $0 | $0 |
| 2016 | $1,190 | $21,500 | $0 | $0 |
| 2015 | $1,186 | $21,700 | $0 | $0 |
| 2014 | $621 | $20,800 | $0 | $0 |
Source: Public Records
Map
Nearby Homes
Your Personal Tour Guide
Ask me questions while you tour the home.