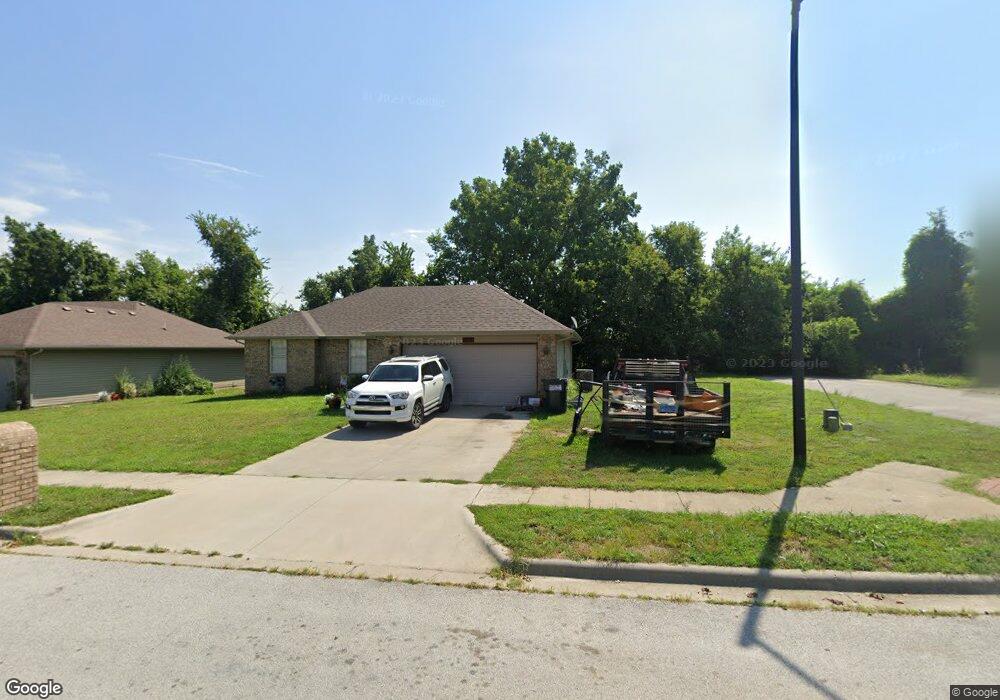
424 N Chandler Ave Republic, MO 65738
Estimated Value: $224,421 - $240,000
3
Beds
2
Baths
1,214
Sq Ft
$190/Sq Ft
Est. Value
About This Home
This home is located at 424 N Chandler Ave, Republic, MO 65738 and is currently estimated at $231,105, approximately $190 per square foot. 424 N Chandler Ave is a home located in Greene County with nearby schools including Sweeny Elementary, Republic Middle School, and Republic High School.
Ownership History
Date
Name
Owned For
Owner Type
Purchase Details
Closed on
Mar 9, 2015
Sold by
Onstot Shaye N
Bought by
Mcnitt Matthew C
Current Estimated Value
Home Financials for this Owner
Home Financials are based on the most recent Mortgage that was taken out on this home.
Original Mortgage
$97,200
Outstanding Balance
$74,172
Interest Rate
3.66%
Mortgage Type
Future Advance Clause Open End Mortgage
Estimated Equity
$156,933
Purchase Details
Closed on
Jun 6, 2010
Sold by
Turner Building & Development Inc
Bought by
Onstot Shaye N
Home Financials for this Owner
Home Financials are based on the most recent Mortgage that was taken out on this home.
Original Mortgage
$101,926
Interest Rate
5.25%
Mortgage Type
FHA
Purchase Details
Closed on
Mar 26, 2010
Sold by
Southwest Community Bank
Bought by
Turner Building & Development Inc
Create a Home Valuation Report for This Property
The Home Valuation Report is an in-depth analysis detailing your home's value as well as a comparison with similar homes in the area
Home Values in the Area
Average Home Value in this Area
Purchase History
| Date | Buyer | Sale Price | Title Company |
|---|---|---|---|
| Mcnitt Matthew C | -- | None Available | |
| Onstot Shaye N | -- | Choice Escrow And Land Title | |
| Turner Building & Development Inc | -- | Fidelity Title Agency |
Source: Public Records
Mortgage History
| Date | Status | Borrower | Loan Amount |
|---|---|---|---|
| Open | Mcnitt Matthew C | $97,200 | |
| Previous Owner | Onstot Shaye N | $101,926 |
Source: Public Records
Tax History Compared to Growth
Tax History
| Year | Tax Paid | Tax Assessment Tax Assessment Total Assessment is a certain percentage of the fair market value that is determined by local assessors to be the total taxable value of land and additions on the property. | Land | Improvement |
|---|---|---|---|---|
| 2025 | $1,502 | $29,850 | $5,700 | $24,150 |
| 2024 | $1,502 | $26,890 | $4,750 | $22,140 |
| 2023 | $1,473 | $26,890 | $4,750 | $22,140 |
| 2022 | $1,273 | $23,120 | $4,750 | $18,370 |
| 2021 | $1,265 | $23,120 | $4,750 | $18,370 |
| 2020 | $1,265 | $22,760 | $4,750 | $18,010 |
| 2019 | $1,261 | $22,760 | $4,750 | $18,010 |
| 2018 | $1,150 | $20,060 | $3,800 | $16,260 |
| 2017 | $1,141 | $19,210 | $3,800 | $15,410 |
| 2016 | $1,104 | $19,210 | $3,800 | $15,410 |
| 2015 | $1,101 | $19,210 | $3,800 | $15,410 |
| 2014 | $1,060 | $18,350 | $3,800 | $14,550 |
Source: Public Records
Map
Nearby Homes
- 715 N Franklin Ave
- 733 N Franklin Ave
- 508 Glenwood Ave
- 515 N Glenwood Ave
- 7217 W Farm Road 182
- 761 N Lexington Ave
- 747 N Glenwood Ave
- 435 N Claremont Place
- 436 N Murphy Dr
- 0 W Farm Road 174 Unit 60286557
- 4889 S Douglas Dr
- 7576 W Farm Road 186
- 2433 E Virginia St
- 2327 E Lee St
- 2465 E Timber Oak St
- 108 Julie Dr
- 1550KP-4 Plan at Greenfield Estates
- 1350 Plan at Greenfield Estates
- 1400 Plan at Greenfield Estates
- 1505KP-4 Cottage Plan at Greenfield Estates
- 424 N Chandler Ave
- 436 N Chandler Ave
- 448 N Chandler Ave
- 427 N Chandler Ave
- 3120 E Marshall St
- 448 N Chandler Ave
- 427 N Chandler Ave
- 3106 E Marshall St
- 439 N Chandler Ave
- 3098 E Marshall St
- 445 N Chandler Ave
- 452 N Chandler Ave
- 3089 E Marshall St
- 3084 E Marshall St
- 453 N Chandler Ave
- 476 N Chandler Ave
- 3082 E Loren St
- 3073 E Marshall St
- 3078 E Marshall St
- 3068 E Loren St