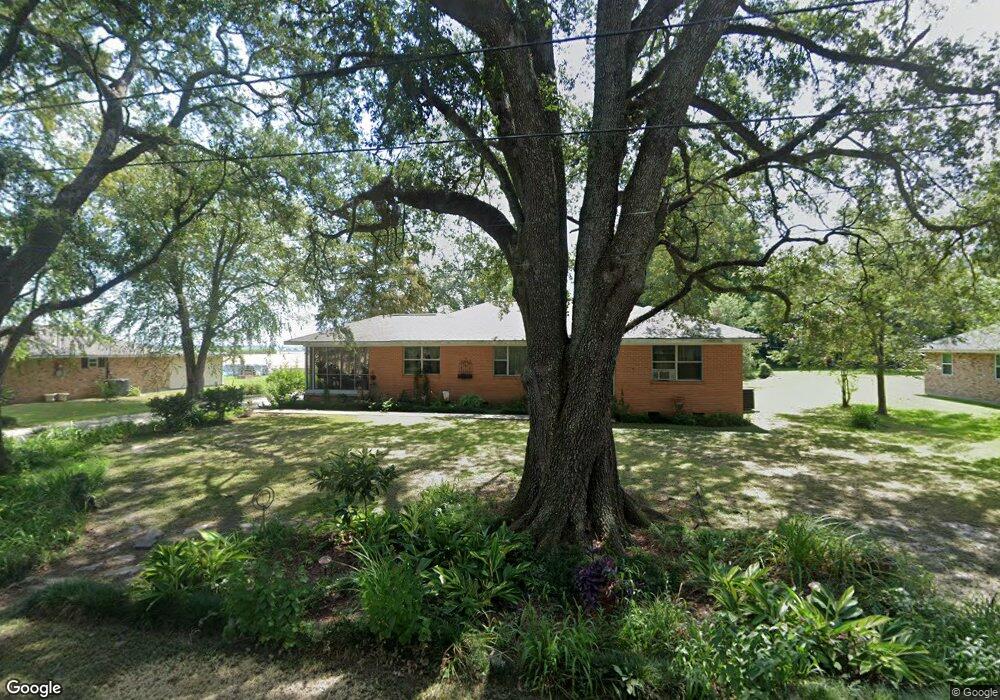
424 N Labauve Rd Brusly, LA 70719
West Baton Rouge Parish NeighborhoodEstimated Value: $284,000 - $297,000
3
Beds
2
Baths
2,026
Sq Ft
$142/Sq Ft
Est. Value
About This Home
This home is located at 424 N Labauve Rd, Brusly, LA 70719 and is currently estimated at $288,090, approximately $142 per square foot. 424 N Labauve Rd is a home located in West Baton Rouge Parish with nearby schools including Brusly Elementary School, Lukeville Upper Elementary School, and Brusly Middle School.
Ownership History
Date
Name
Owned For
Owner Type
Purchase Details
Closed on
Jul 18, 2008
Sold by
Melancon Michael G
Bought by
Mistric Parsons Thomas Brian and Mistric Parson Peggy
Current Estimated Value
Home Financials for this Owner
Home Financials are based on the most recent Mortgage that was taken out on this home.
Original Mortgage
$142,000
Interest Rate
6.4%
Mortgage Type
New Conventional
Purchase Details
Closed on
Jan 12, 2007
Sold by
Marionneaux Beaver Cynthia A and Marionneaux Minta S
Bought by
Melancon Michael G
Home Financials for this Owner
Home Financials are based on the most recent Mortgage that was taken out on this home.
Original Mortgage
$30,076
Interest Rate
6.1%
Mortgage Type
Stand Alone Second
Create a Home Valuation Report for This Property
The Home Valuation Report is an in-depth analysis detailing your home's value as well as a comparison with similar homes in the area
Home Values in the Area
Average Home Value in this Area
Purchase History
| Date | Buyer | Sale Price | Title Company |
|---|---|---|---|
| Mistric Parsons Thomas Brian | $177,500 | None Available | |
| Melancon Michael G | $150,380 | None Available |
Source: Public Records
Mortgage History
| Date | Status | Borrower | Loan Amount |
|---|---|---|---|
| Closed | Mistric Parsons Thomas Brian | $142,000 | |
| Previous Owner | Melancon Michael G | $30,076 | |
| Previous Owner | Melancon Michael G | $120,304 |
Source: Public Records
Tax History Compared to Growth
Tax History
| Year | Tax Paid | Tax Assessment Tax Assessment Total Assessment is a certain percentage of the fair market value that is determined by local assessors to be the total taxable value of land and additions on the property. | Land | Improvement |
|---|---|---|---|---|
| 2024 | $1,462 | $22,590 | $3,900 | $18,690 |
| 2023 | $1,013 | $17,260 | $3,380 | $13,880 |
| 2022 | $1,810 | $17,260 | $3,380 | $13,880 |
| 2021 | $1,851 | $17,260 | $3,380 | $13,880 |
| 2020 | $1,682 | $15,530 | $3,040 | $12,490 |
| 2019 | $1,981 | $17,560 | $2,650 | $14,910 |
| 2018 | $2,017 | $17,560 | $2,650 | $14,910 |
| 2017 | $1,863 | $17,560 | $2,650 | $14,910 |
| 2015 | $1,497 | $17,430 | $2,520 | $14,910 |
| 2014 | $1,473 | $17,430 | $2,520 | $14,910 |
| 2013 | $908 | $10,750 | $2,520 | $8,230 |
Source: Public Records
Map
Nearby Homes
- 2209 Live Oak Dr
- 2382 Ory Dr
- 6455 Louisiana 1
- 6312 Louisiana 1
- 2809 Live Oak Dr
- 2821 Live Oak Dr
- 4123 Choctaw Rd
- 3561 Lukeville Ln
- 2742 Emily Dr
- 6423 Choctaw Rd
- 526 Gwin St
- 3200 Orleans Quarters Dr
- 540 Bourgeois St
- 2805 Live Oak Dr
- 2820 Live Oak Dr
- 2824 Live Oak Dr
- 407 Gleason St
- 3609 Loup Ln
- 3675 Union Dr
- 2217 Silverstone Ave
- 408 N Labauve Rd
- 460 N Labauve Rd
- 460 N Labauve Ave
- 350 N Labauve Rd
- 411 N Labauve Rd
- 2200 N Labauve Ave
- 501 N Labauve Ave
- 501 N Labauve Ave
- 341 N Labauve Rd
- 433 N Labauve Rd
- 1420 Allene St
- 323 N Labauve Rd
- 182 N Labauve Ave
- 539 N Labauve Ave
- 246 N Labauve Ave
- 246 N Labauve Ave
- 246 N Labauve Ave
- 301 N Labauve Ave
- 1423 Allene St
- 260 N Labauve Rd