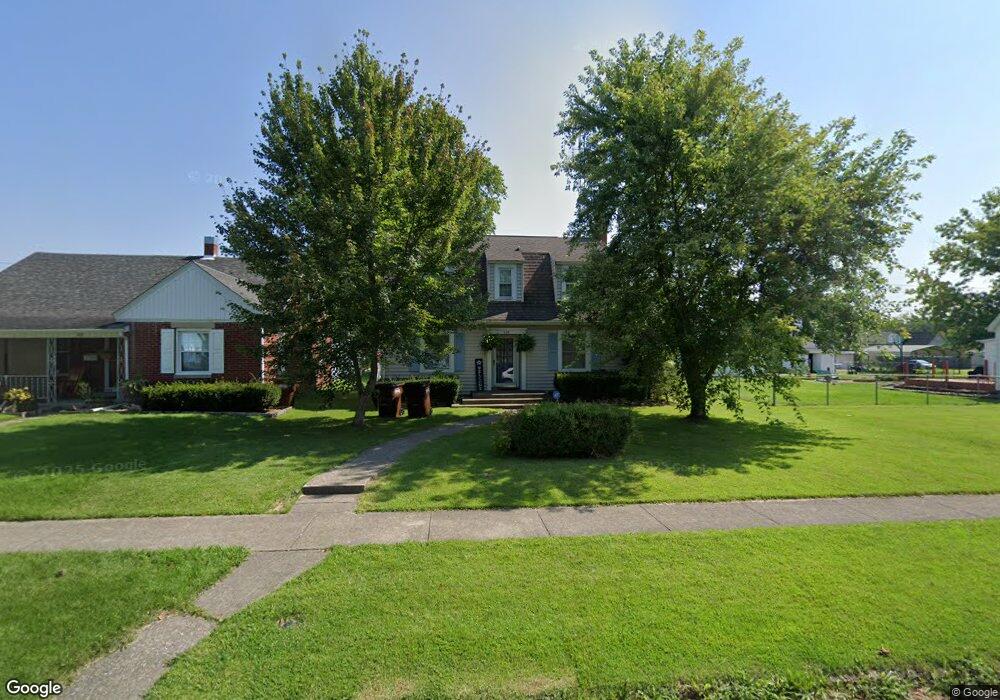
424 S Elm St North Vernon, IN 47265
Estimated Value: $185,000 - $195,000
3
Beds
2
Baths
1,814
Sq Ft
$105/Sq Ft
Est. Value
About This Home
This home is located at 424 S Elm St, North Vernon, IN 47265 and is currently estimated at $190,325, approximately $104 per square foot. 424 S Elm St is a home located in Jennings County with nearby schools including North Vernon Elementary School, Jennings County Middle School, and Jennings County High School.
Ownership History
Date
Name
Owned For
Owner Type
Purchase Details
Closed on
Dec 24, 2020
Sold by
Roane James R and Roane Sheila M
Bought by
Kreinhagen Laura A
Current Estimated Value
Home Financials for this Owner
Home Financials are based on the most recent Mortgage that was taken out on this home.
Original Mortgage
$48,000
Outstanding Balance
$42,908
Interest Rate
2.8%
Mortgage Type
Land Contract Argmt. Of Sale
Estimated Equity
$147,417
Purchase Details
Closed on
Jul 11, 2008
Sold by
Indiana Bank & Trust Company
Bought by
Roane James R and Roane Sheila
Purchase Details
Closed on
Apr 15, 2008
Sold by
Gay Carol Davis and Davis Carol Ann
Bought by
Indiana Bank And Trust Co and Homefederal Bank
Purchase Details
Closed on
Jul 13, 2001
Sold by
Douglas Jon P and Douglas Rochelle L
Bought by
Gay Carol Davis
Purchase Details
Closed on
Dec 7, 1998
Sold by
Sharp Jerry D
Bought by
Douglas Jon P and Douglas Rochelle L
Create a Home Valuation Report for This Property
The Home Valuation Report is an in-depth analysis detailing your home's value as well as a comparison with similar homes in the area
Home Values in the Area
Average Home Value in this Area
Purchase History
| Date | Buyer | Sale Price | Title Company |
|---|---|---|---|
| Kreinhagen Laura A | $138,000 | None Available | |
| Roane James R | $95,000 | North Vernon Abstract Co Inc | |
| Roane James R | -- | None Available | |
| Indiana Bank And Trust Co | $80,000 | None Available | |
| Gay Carol Davis | $95,000 | -- | |
| Douglas Jon P | $50,781 | -- |
Source: Public Records
Mortgage History
| Date | Status | Borrower | Loan Amount |
|---|---|---|---|
| Open | Kreinhagen Laura A | $48,000 |
Source: Public Records
Tax History Compared to Growth
Tax History
| Year | Tax Paid | Tax Assessment Tax Assessment Total Assessment is a certain percentage of the fair market value that is determined by local assessors to be the total taxable value of land and additions on the property. | Land | Improvement |
|---|---|---|---|---|
| 2024 | $1,001 | $100,100 | $9,800 | $90,300 |
| 2023 | $1,070 | $107,000 | $9,800 | $97,200 |
| 2022 | $1,060 | $106,000 | $9,800 | $96,200 |
| 2021 | $964 | $96,400 | $9,800 | $86,600 |
| 2020 | $908 | $94,000 | $9,800 | $84,200 |
| 2019 | $1,946 | $97,300 | $9,800 | $87,500 |
| 2018 | $1,946 | $97,300 | $9,800 | $87,500 |
| 2017 | $1,924 | $96,200 | $9,800 | $86,400 |
| 2016 | $1,924 | $96,200 | $9,800 | $86,400 |
| 2014 | $1,926 | $96,300 | $9,800 | $86,500 |
Source: Public Records
Map
Nearby Homes
- 243 Lincoln St
- 215 S Gum St
- 25 W Chestnut St
- 3 S State St
- 26 Oakwood Ave
- 112 Sunnyside Dr
- 150 W Walnut St
- 210 Norris Ave
- 82 Norris Ave
- 237 Norris Ave
- 100 Durbin St
- 174 E Norris Heights
- 10 Hicks St
- 987 E Summit St
- 0 W Walnut St Unit MBR22050857
- 208 South St
- 135 Flintwood Dr W
- 604 N Elm St
- 3 N State St
- 213 Shull Dr