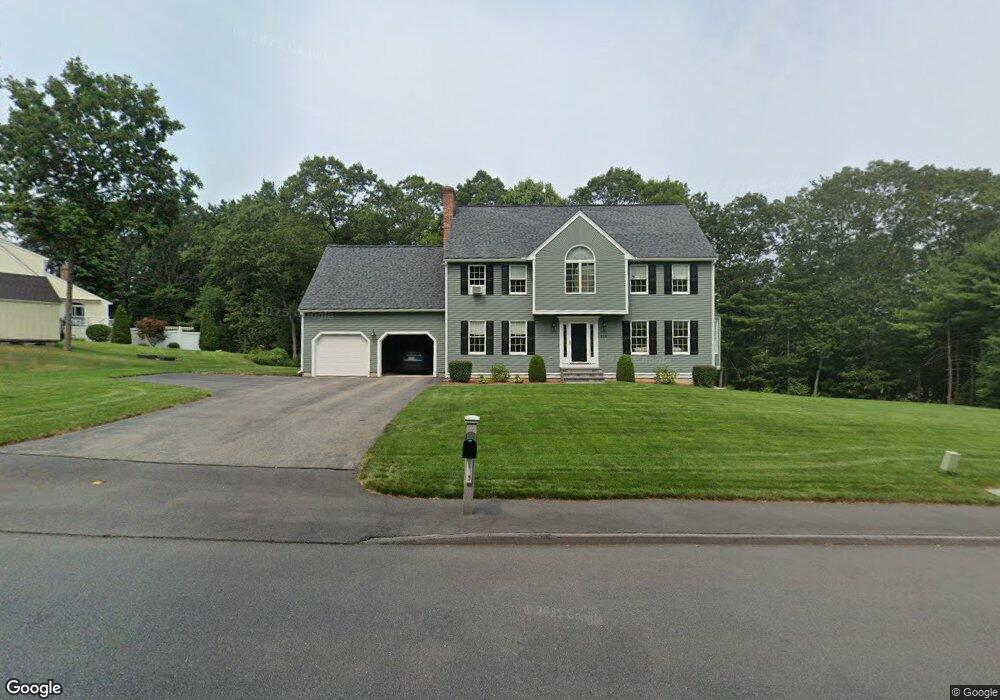
424 Simpson Rd Marlborough, MA 01752
Estimated Value: $791,164 - $879,000
4
Beds
3
Baths
2,524
Sq Ft
$328/Sq Ft
Est. Value
About This Home
This home is located at 424 Simpson Rd, Marlborough, MA 01752 and is currently estimated at $827,791, approximately $327 per square foot. 424 Simpson Rd is a home located in Middlesex County with nearby schools including Marlborough High School, New Covenant Christian School, and Glenhaven Academy - JRI School.
Ownership History
Date
Name
Owned For
Owner Type
Purchase Details
Closed on
Aug 30, 1990
Sold by
Kendall Homes Inc
Bought by
Mattioli Robt E
Current Estimated Value
Home Financials for this Owner
Home Financials are based on the most recent Mortgage that was taken out on this home.
Original Mortgage
$170,000
Interest Rate
9.85%
Mortgage Type
Purchase Money Mortgage
Create a Home Valuation Report for This Property
The Home Valuation Report is an in-depth analysis detailing your home's value as well as a comparison with similar homes in the area
Home Values in the Area
Average Home Value in this Area
Purchase History
| Date | Buyer | Sale Price | Title Company |
|---|---|---|---|
| Mattioli Robt E | $273,000 | -- |
Source: Public Records
Mortgage History
| Date | Status | Borrower | Loan Amount |
|---|---|---|---|
| Closed | Mattioli Robt E | $168,000 | |
| Closed | Mattioli Robt E | $170,000 | |
| Previous Owner | Mattioli Robt E | $10,000 | |
| Previous Owner | Mattioli Robt E | $180,000 |
Source: Public Records
Tax History
| Year | Tax Paid | Tax Assessment Tax Assessment Total Assessment is a certain percentage of the fair market value that is determined by local assessors to be the total taxable value of land and additions on the property. | Land | Improvement |
|---|---|---|---|---|
| 2025 | $7,115 | $721,600 | $228,900 | $492,700 |
| 2024 | $6,991 | $682,700 | $208,200 | $474,500 |
| 2023 | $7,261 | $629,200 | $179,400 | $449,800 |
| 2022 | $7,013 | $534,500 | $170,900 | $363,600 |
| 2021 | $6,957 | $504,100 | $142,500 | $361,600 |
| 2020 | $6,831 | $481,700 | $135,700 | $346,000 |
| 2019 | $6,593 | $468,600 | $133,000 | $335,600 |
| 2018 | $6,554 | $448,000 | $115,400 | $332,600 |
| 2017 | $6,511 | $425,000 | $113,200 | $311,800 |
| 2016 | $6,352 | $414,100 | $113,200 | $300,900 |
| 2015 | $6,217 | $394,500 | $115,400 | $279,100 |
Source: Public Records
Map
Nearby Homes
- 84 Crosby Rd
- 38 Airport Blvd
- 168 Blanchette Dr
- 92 Porter Rd
- 68 Upland Rd
- 9 & 9A Abigail
- 0 Stevens St
- 20 Beauregard Cir
- 110 Boston Post Rd E Unit 104
- 48 Cook Ln
- 181 Boston Post Rd E Unit 26
- 181 Boston Post Rd E Unit 64
- 688 Boston Post Rd E Unit 202
- 688 Boston Post Rd E Unit 100
- 688 Boston Post Rd E Unit 304
- 688 Boston Post Rd E Unit 103
- 596 Boston Post Rd E Unit 13
- 24 Wilson St Unit 4
- 70 Victoria Ln
- 14 Turner Ridge Rd
Your Personal Tour Guide
Ask me questions while you tour the home.