Estimated Value: $441,000 - $508,000
Studio
--
Bath
4,384
Sq Ft
$108/Sq Ft
Est. Value
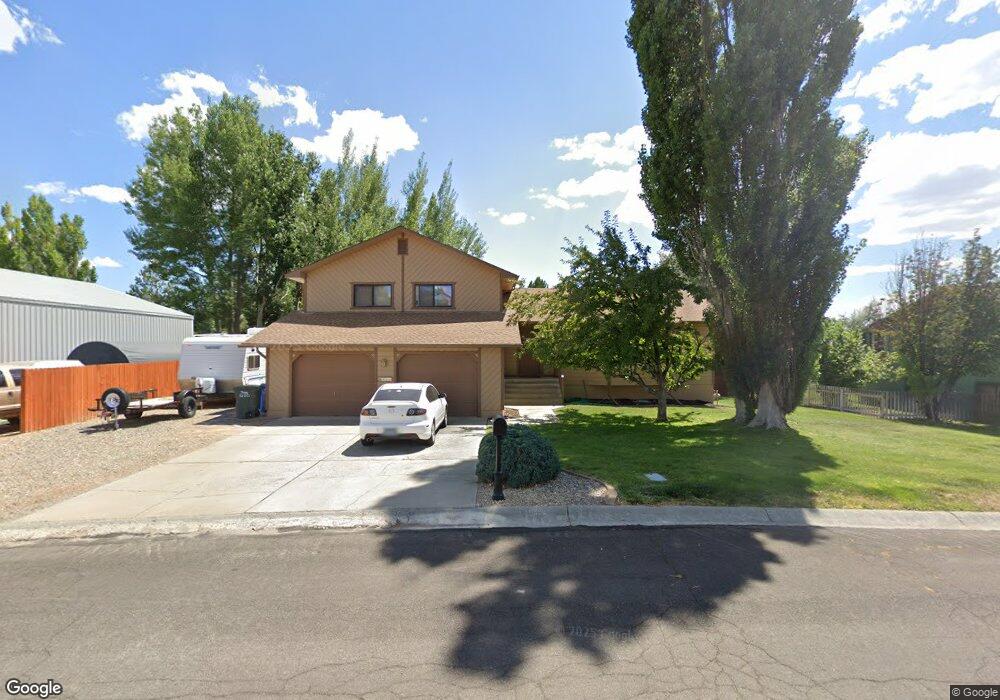
About This Home
This home is located at 424 Skyline Dr, Elko, NV 89801 and is currently estimated at $474,847, approximately $108 per square foot. 424 Skyline Dr is a home located in Elko County with nearby schools including Elko Grammar School #2, Flagview Intermediate School, and Adobe Middle School.
Ownership History
Date
Name
Owned For
Owner Type
Purchase Details
Closed on
Sep 17, 2010
Sold by
Federal Home Loan Mortgage Corporation
Bought by
Ozman Donald
Current Estimated Value
Home Financials for this Owner
Home Financials are based on the most recent Mortgage that was taken out on this home.
Original Mortgage
$226,330
Outstanding Balance
$148,997
Interest Rate
4.38%
Mortgage Type
FHA
Estimated Equity
$325,850
Purchase Details
Closed on
Aug 5, 2009
Sold by
Jory John C and Wheeler Melissa T
Bought by
Federal Home Loan Mortgage Corporation
Purchase Details
Closed on
Sep 6, 2006
Sold by
Gorman Mark G and Gorman Jennifer W
Bought by
Jory John C and Wheeler Melissa T
Home Financials for this Owner
Home Financials are based on the most recent Mortgage that was taken out on this home.
Original Mortgage
$252,000
Interest Rate
6.13%
Mortgage Type
Purchase Money Mortgage
Create a Home Valuation Report for This Property
The Home Valuation Report is an in-depth analysis detailing your home's value as well as a comparison with similar homes in the area
Purchase History
| Date | Buyer | Sale Price | Title Company |
|---|---|---|---|
| Ozman Donald | $233,000 | Stewart Title Las Vegas W | |
| Federal Home Loan Mortgage Corporation | $254,122 | Lsi Title Agency Inc | |
| Jory John C | $315,000 | Stewart Title |
Source: Public Records
Mortgage History
| Date | Status | Borrower | Loan Amount |
|---|---|---|---|
| Open | Ozman Donald | $226,330 | |
| Previous Owner | Jory John C | $252,000 |
Source: Public Records
Tax History
| Year | Tax Paid | Tax Assessment Tax Assessment Total Assessment is a certain percentage of the fair market value that is determined by local assessors to be the total taxable value of land and additions on the property. | Land | Improvement |
|---|---|---|---|---|
| 2025 | $3,073 | $94,315 | $24,500 | $69,815 |
| 2024 | $3,073 | $90,659 | $21,875 | $68,784 |
| 2023 | $2,808 | $86,939 | $21,875 | $65,064 |
| 2022 | $2,726 | $77,529 | $21,875 | $55,654 |
| 2021 | $2,647 | $76,445 | $21,875 | $54,570 |
| 2020 | $2,569 | $77,539 | $21,875 | $55,664 |
| 2019 | $2,494 | $71,587 | $18,375 | $53,212 |
| 2018 | $2,513 | $72,150 | $18,375 | $53,775 |
| 2017 | $2,495 | $71,628 | $18,375 | $53,253 |
| 2016 | $2,529 | $72,284 | $18,375 | $53,909 |
| 2015 | $2,517 | $69,918 | $18,375 | $51,543 |
| 2014 | $2,431 | $67,753 | $18,375 | $49,378 |
Source: Public Records
Map
Nearby Homes
- 2001 Eagle Dr Unit 1
- 2009 Eagle Dr Unit 3
- 2086 Russell Dr
- 0 Interstate 80
- 1862 Laxalt Way
- 2405 Mittry Ave
- 2617 Platinum Dr
- 2607 Platinum Dr
- 2366 Khoury Ln
- 2413 5th St
- 2421 5th St
- 2427 5th St
- 2618 Platinum Dr
- 2503 5th St
- 2505 5th St
- 2511 5th St
- Country Rd Unit Mountain Meadows Ran
- 2519 5th St
- 1380 Oak St
- 2489 5th St
- 450 Skyline Dr
- 400 Skyline Dr
- 325 Skyline Dr
- 474 Skyline Dr
- 1355 Parkview Dr
- 1325 Parkview Dr
- 366 Keppler Dr
- 334 Keppler Dr
- 486 Skyline Dr
- 1301 Parkview Dr
- 295 Skyline Dr
- 1350 Parkview Dr
- 294 Skyline Dr
- 335 Keppler Dr
- 1263 Mountain View Dr
- 502 Skyline Dr
- 1300 Parkview Dr
- 1289 Parkview Dr
- 254 Skyline Dr
- 255 Skyline Dr
Your Personal Tour Guide
Ask me questions while you tour the home.