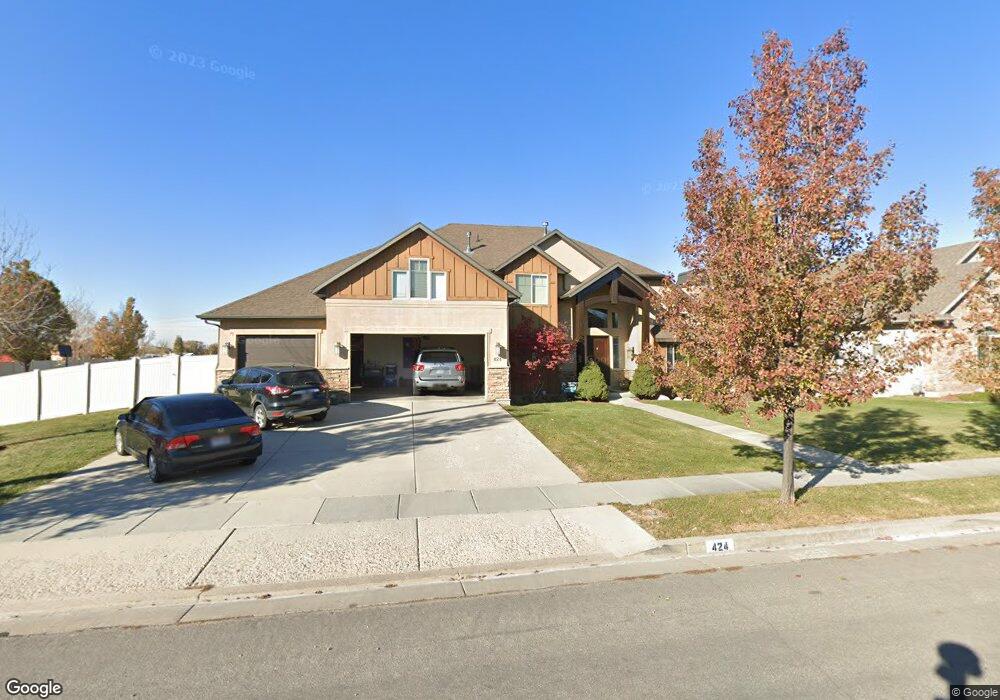
424 W Paddock Ln Kaysville, UT 84037
West Kaysville NeighborhoodEstimated Value: $957,000 - $1,044,129
3
Beds
3
Baths
4,867
Sq Ft
$209/Sq Ft
Est. Value
About This Home
This home is located at 424 W Paddock Ln, Kaysville, UT 84037 and is currently estimated at $1,017,782, approximately $209 per square foot. 424 W Paddock Ln is a home located in Davis County with nearby schools including Endeavour Elementary School, Farmington High, and Centennial Junior High School.
Ownership History
Date
Name
Owned For
Owner Type
Purchase Details
Closed on
Jul 17, 2024
Sold by
Bell Daren and Bell Janet H
Bought by
Daren & Janet Bell Family Revocable Trust and Bell
Current Estimated Value
Purchase Details
Closed on
Oct 29, 2010
Sold by
Bell Daren
Bought by
Bell Daren and Bell Janet H
Home Financials for this Owner
Home Financials are based on the most recent Mortgage that was taken out on this home.
Original Mortgage
$390,738
Interest Rate
4.25%
Mortgage Type
FHA
Purchase Details
Closed on
Oct 26, 2010
Sold by
Waldron Family Limited Partnership
Bought by
Bell Daren
Home Financials for this Owner
Home Financials are based on the most recent Mortgage that was taken out on this home.
Original Mortgage
$390,738
Interest Rate
4.25%
Mortgage Type
FHA
Purchase Details
Closed on
Mar 7, 2008
Sold by
Smith Scott
Bought by
Waldron Family Lp
Purchase Details
Closed on
Jun 12, 2006
Sold by
Woodside Sunset Farms Llc
Bought by
Smith Scott
Create a Home Valuation Report for This Property
The Home Valuation Report is an in-depth analysis detailing your home's value as well as a comparison with similar homes in the area
Home Values in the Area
Average Home Value in this Area
Purchase History
| Date | Buyer | Sale Price | Title Company |
|---|---|---|---|
| Daren & Janet Bell Family Revocable Trust | -- | None Listed On Document | |
| Bell Daren | -- | Meridian Title Company | |
| Bell Daren | -- | Metro National Title | |
| Waldron Family Lp | -- | Metro National Title | |
| Smith Scott | -- | Us Title Company Of Utah |
Source: Public Records
Mortgage History
| Date | Status | Borrower | Loan Amount |
|---|---|---|---|
| Previous Owner | Bell Daren | $390,738 |
Source: Public Records
Tax History Compared to Growth
Tax History
| Year | Tax Paid | Tax Assessment Tax Assessment Total Assessment is a certain percentage of the fair market value that is determined by local assessors to be the total taxable value of land and additions on the property. | Land | Improvement |
|---|---|---|---|---|
| 2025 | $4,381 | $487,300 | $215,401 | $271,899 |
| 2024 | $4,381 | $462,000 | $207,219 | $254,781 |
| 2023 | $4,338 | $810,000 | $362,853 | $447,147 |
| 2022 | $4,363 | $457,050 | $197,797 | $259,253 |
| 2021 | $4,210 | $661,000 | $239,950 | $421,050 |
| 2020 | $3,891 | $595,000 | $205,963 | $389,037 |
| 2019 | $3,770 | $566,000 | $202,708 | $363,292 |
| 2018 | $3,467 | $519,000 | $172,808 | $346,192 |
| 2016 | $3,396 | $267,245 | $81,419 | $185,826 |
| 2015 | $3,473 | $259,435 | $81,419 | $178,016 |
| 2014 | $3,196 | $243,071 | $64,000 | $179,071 |
| 2013 | -- | $193,505 | $59,388 | $134,117 |
Source: Public Records
Map
Nearby Homes
- 461 W Summit Ln
- Butler Traditional Plan at Crested Peaks
- 874 W Steeple Chase Dr
- 1248 S Kentucky Derby Way
- 879 W Saddlebrook Dr
- 87 Baer Creek Dr
- 1310 S 125 E
- 245 E 1400 S
- 1315 S 175 E
- Timpani Plan at Sunset Equestrian
- Octave Plan at Sunset Equestrian
- Madrigal Plan at Sunset Equestrian
- Harvard Plan at Sunset Equestrian
- Fortissimo Plan at Sunset Equestrian
- Canon Plan at Sunset Equestrian
- Finale Plan at Sunset Equestrian
- Forte Plan at Sunset Equestrian
- Bravo Plan at Sunset Equestrian
- Accord Plan at Sunset Equestrian
- Ballad Plan at Sunset Equestrian
- 406 W Paddock Ln
- 406 Paddock Ln
- 444 Paddock Ln
- 409 Paddock Ln
- 388 W Paddock Ln
- 427 W Paddock Ln
- 388 Paddock Ln
- 445 Paddock Ln
- 460 Paddock Ln
- 391 Paddock Ln
- 370 W Paddock Ln
- 463 Paddock Ln
- 463 Paddock Ln Unit 420
- 370 Paddock Ln
- 375 Paddock Ln
- 463 W Paddock Ln
- 375 W Paddock Ln
- 478 Paddock Ln
- 352 W Paddock Ln
- 481 Paddock Ln