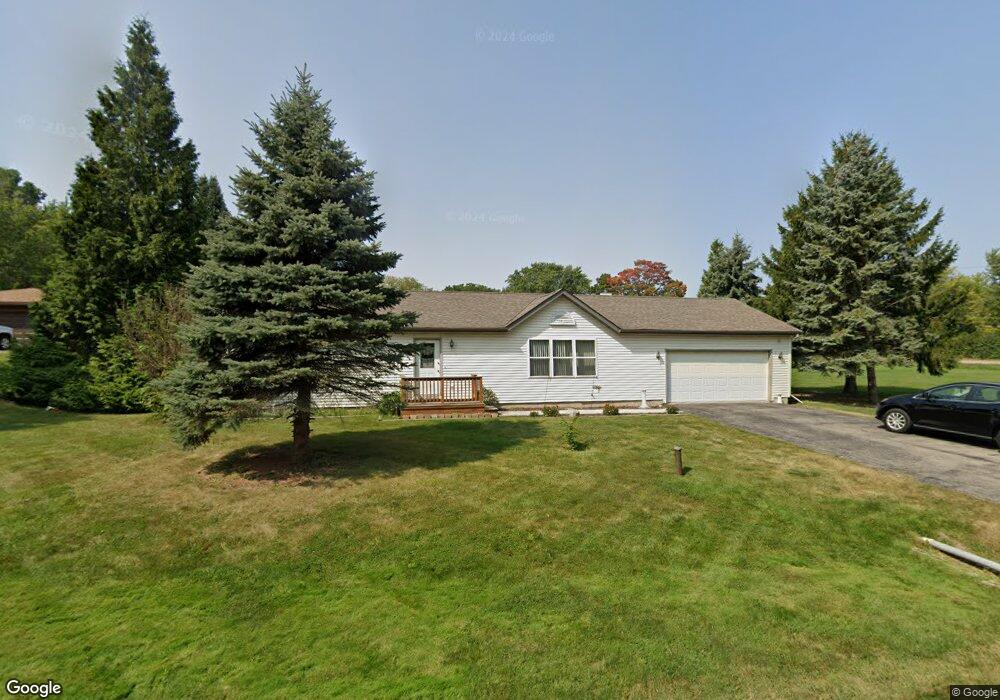
42402 N Hayner Ave Zion, IL 60099
Shore Acres NeighborhoodEstimated Value: $285,000 - $323,000
3
Beds
3
Baths
1,300
Sq Ft
$236/Sq Ft
Est. Value
About This Home
This home is located at 42402 N Hayner Ave, Zion, IL 60099 and is currently estimated at $307,305, approximately $236 per square foot. 42402 N Hayner Ave is a home located in Lake County with nearby schools including Kenneth Murphy School, Beach Park Middle School, and Zion-Benton Township High School.
Ownership History
Date
Name
Owned For
Owner Type
Purchase Details
Closed on
Oct 16, 2020
Sold by
Duda Pamela K and Sears Lola C
Bought by
Sandoval Doris and Sandoval Aristides
Current Estimated Value
Home Financials for this Owner
Home Financials are based on the most recent Mortgage that was taken out on this home.
Original Mortgage
$164,900
Outstanding Balance
$147,585
Interest Rate
3.25%
Mortgage Type
New Conventional
Estimated Equity
$159,720
Purchase Details
Closed on
Feb 26, 2010
Sold by
Duda Pamela A and Duda Charles A
Bought by
Sears Lola C
Purchase Details
Closed on
Sep 8, 2006
Sold by
Sears Lola C
Bought by
Duda Pamela A and Duda Charles A
Purchase Details
Closed on
Feb 14, 2002
Sold by
Decesaro Peter T
Bought by
Sears Lola C
Home Financials for this Owner
Home Financials are based on the most recent Mortgage that was taken out on this home.
Original Mortgage
$120,000
Interest Rate
6.95%
Purchase Details
Closed on
Jul 10, 1995
Sold by
Bolton Wilbert W and Bolton June
Bought by
Decesaro Peter T
Create a Home Valuation Report for This Property
The Home Valuation Report is an in-depth analysis detailing your home's value as well as a comparison with similar homes in the area
Home Values in the Area
Average Home Value in this Area
Purchase History
| Date | Buyer | Sale Price | Title Company |
|---|---|---|---|
| Sandoval Doris | $170,000 | Chicago Title | |
| Sears Lola C | -- | None Available | |
| Duda Pamela A | -- | None Available | |
| Sears Lola C | $152,000 | First American Title | |
| Decesaro Peter T | $30,000 | Ticor Title Insurance Compan |
Source: Public Records
Mortgage History
| Date | Status | Borrower | Loan Amount |
|---|---|---|---|
| Open | Sandoval Doris | $164,900 | |
| Previous Owner | Sears Lola C | $120,000 |
Source: Public Records
Tax History Compared to Growth
Tax History
| Year | Tax Paid | Tax Assessment Tax Assessment Total Assessment is a certain percentage of the fair market value that is determined by local assessors to be the total taxable value of land and additions on the property. | Land | Improvement |
|---|---|---|---|---|
| 2024 | $6,089 | $80,411 | $9,942 | $70,469 |
| 2023 | $5,831 | $70,115 | $9,597 | $60,518 |
| 2022 | $5,831 | $64,544 | $9,375 | $55,169 |
| 2021 | $5,688 | $59,860 | $9,137 | $50,723 |
| 2020 | $3,456 | $57,123 | $8,719 | $48,404 |
| 2019 | $3,601 | $54,196 | $8,272 | $45,924 |
| 2018 | $3,917 | $57,016 | $10,042 | $46,974 |
| 2017 | $4,018 | $53,637 | $9,447 | $44,190 |
| 2016 | $4,128 | $51,064 | $8,994 | $42,070 |
| 2015 | $4,402 | $46,830 | $8,248 | $38,582 |
| 2014 | $4,155 | $42,816 | $6,867 | $35,949 |
| 2012 | $4,395 | $44,493 | $7,136 | $37,357 |
Source: Public Records
Map
Nearby Homes
- 1304 Pelican Ct
- 42908 N Lewis Ave
- 0 9th St
- 3707 Willow Crest Dr
- 3717 Willow Crest Dr
- 1531 Southport Ct
- 1405 Lewis Ave
- 1521 Southport Ct
- 43100 N Lewis Ave
- 1302 Lorelei Dr
- 4014 Ridge Rd
- 210 Oak Ln
- 1417 Westside Trail
- 429 Megan Place
- 908 Countrywood Dr
- Lt0 128th St
- 11279 W Russell Rd
- 3106 13th St
- 1703 Hermon Ave
- 43389 N Oakcrest Ln
- 42432 N Hayner Ave
- 11797 W 9th St
- 925 Hayner Ave
- 11721 W 9th St
- 42390 N Hayner Ave
- 11833 W 9th St
- 4720 10th St
- 11679 W 9th St
- 42461 N Broecker Ave
- 42437 N Broecker Ave
- 11859 W 9th St
- 42421 N Broecker Ave
- 42362 N Hayner Ave
- 42361 N Thorpe Ave
- 42389 N Broecker Ave
- 42361 N Hayner Ave
- 11647 W 9th St
- 42340 N Hayner Ave
- 42339 N Thorpe Ave
- 4625 10th St