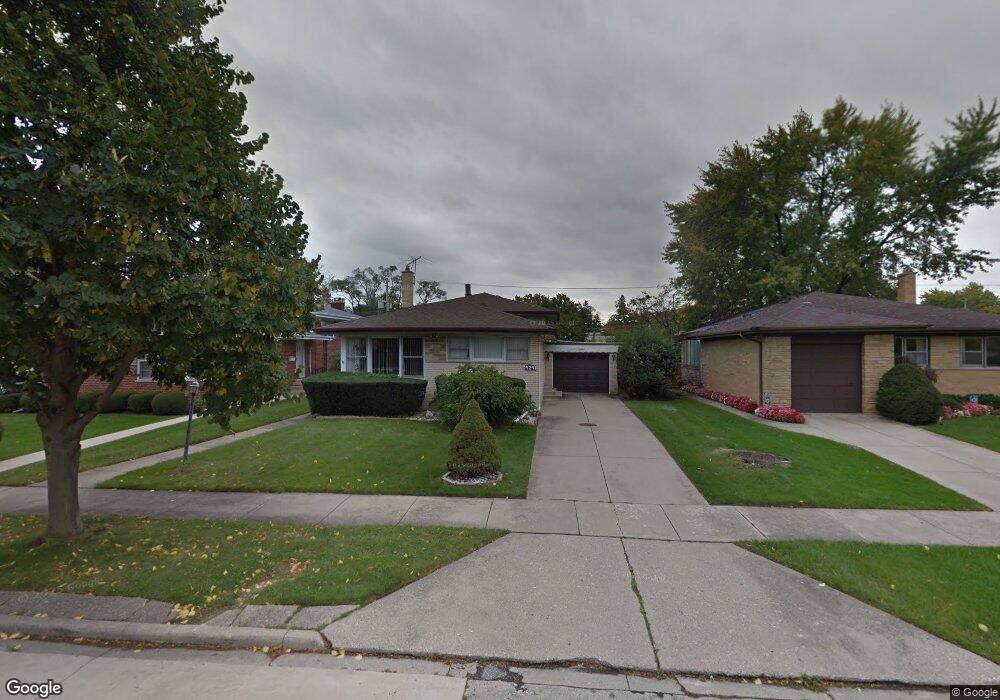
4241 Enfield Ave Skokie, IL 60076
North Skokie NeighborhoodEstimated Value: $507,998 - $572,000
3
Beds
2
Baths
1,422
Sq Ft
$382/Sq Ft
Est. Value
About This Home
This home is located at 4241 Enfield Ave, Skokie, IL 60076 and is currently estimated at $542,500, approximately $381 per square foot. 4241 Enfield Ave is a home located in Cook County with nearby schools including Old Orchard Jr High School, Devonshire Elementary School, and Niles North High School.
Ownership History
Date
Name
Owned For
Owner Type
Purchase Details
Closed on
Apr 20, 2001
Sold by
Mabadi Abol and Mabadi Marianne L
Bought by
Samuel Varkey and Samuel Susamma
Current Estimated Value
Home Financials for this Owner
Home Financials are based on the most recent Mortgage that was taken out on this home.
Original Mortgage
$175,000
Interest Rate
7.05%
Purchase Details
Closed on
Apr 28, 1999
Sold by
Mabadi Marianne L
Bought by
Mabadi Abol and Mabadi Marianne L
Home Financials for this Owner
Home Financials are based on the most recent Mortgage that was taken out on this home.
Original Mortgage
$240,000
Interest Rate
6.25%
Purchase Details
Closed on
Dec 9, 1997
Sold by
Mabadi Abol G
Bought by
Mabadi Marianne L
Purchase Details
Closed on
Aug 25, 1995
Sold by
Mabadi Abol G
Bought by
Mabadi Marianne L
Create a Home Valuation Report for This Property
The Home Valuation Report is an in-depth analysis detailing your home's value as well as a comparison with similar homes in the area
Home Values in the Area
Average Home Value in this Area
Purchase History
| Date | Buyer | Sale Price | Title Company |
|---|---|---|---|
| Samuel Varkey | $325,000 | Centennial Title Incorporate | |
| Mabadi Abol | -- | -- | |
| Mabadi Marianne L | -- | Chicago Title Insurance Co | |
| Mabadi Marianne L | -- | -- | |
| Mabadi Abol G | -- | -- |
Source: Public Records
Mortgage History
| Date | Status | Borrower | Loan Amount |
|---|---|---|---|
| Closed | Samuel Varkey | $175,000 | |
| Previous Owner | Mabadi Abol | $240,000 |
Source: Public Records
Tax History Compared to Growth
Tax History
| Year | Tax Paid | Tax Assessment Tax Assessment Total Assessment is a certain percentage of the fair market value that is determined by local assessors to be the total taxable value of land and additions on the property. | Land | Improvement |
|---|---|---|---|---|
| 2024 | $8,752 | $41,000 | $8,250 | $32,750 |
| 2023 | $8,473 | $41,000 | $8,250 | $32,750 |
| 2022 | $8,473 | $41,000 | $8,250 | $32,750 |
| 2021 | $6,412 | $29,423 | $5,671 | $23,752 |
| 2020 | $6,460 | $29,423 | $5,671 | $23,752 |
| 2019 | $6,445 | $32,334 | $5,671 | $26,663 |
| 2018 | $6,535 | $30,440 | $4,984 | $25,456 |
| 2017 | $7,344 | $30,440 | $4,984 | $25,456 |
| 2016 | $7,779 | $32,482 | $4,984 | $27,498 |
| 2015 | $6,194 | $24,815 | $4,296 | $20,519 |
| 2014 | $6,065 | $24,815 | $4,296 | $20,519 |
| 2013 | $7,114 | $28,783 | $4,296 | $24,487 |
Source: Public Records
Map
Nearby Homes
- 8720 Karlov Ave
- 9010 Keeler Ave
- 3358 Dempster St
- 8449 Kedvale Ave
- 4310 Church St
- 4410 Bobolink Terrace
- 4218 Main St
- 9246 Kildare Ave
- 9100 Kenton Ave
- 9249 Kildare Ave
- 9101 Sleeping Bear Rd
- 8414 Crawford Ave
- 9121 Niles Center Rd Unit 2W
- 4354 Lyons St
- 9234 Kolmar Ave
- 4735 Grove St Unit 103
- 7825 Kolmar Ave
- 9333 Kildare Ave
- 8600 E Prairie Rd
- 8301 Karlov Ave
- 4247 Enfield Ave
- 4235 Enfield Ave
- 4231 Enfield Ave
- 4240 Dempster St
- 4225 Enfield Ave
- 8825 Kildare Ave
- 8825 Kildare Ave
- 4232 Dempster St
- 4242 Enfield Ave
- 4242 Enfield Ave
- 4236 Enfield Ave
- 4236 Enfield Ave
- 4246 Enfield Ave
- 4250 Enfield Ave
- 4250 Enfield Ave
- 4228 Enfield Ave
- 4228 Enfield Ave
- 4250 Dempster St
- 8833 Kildare Ave
- 8833 Kildare Ave