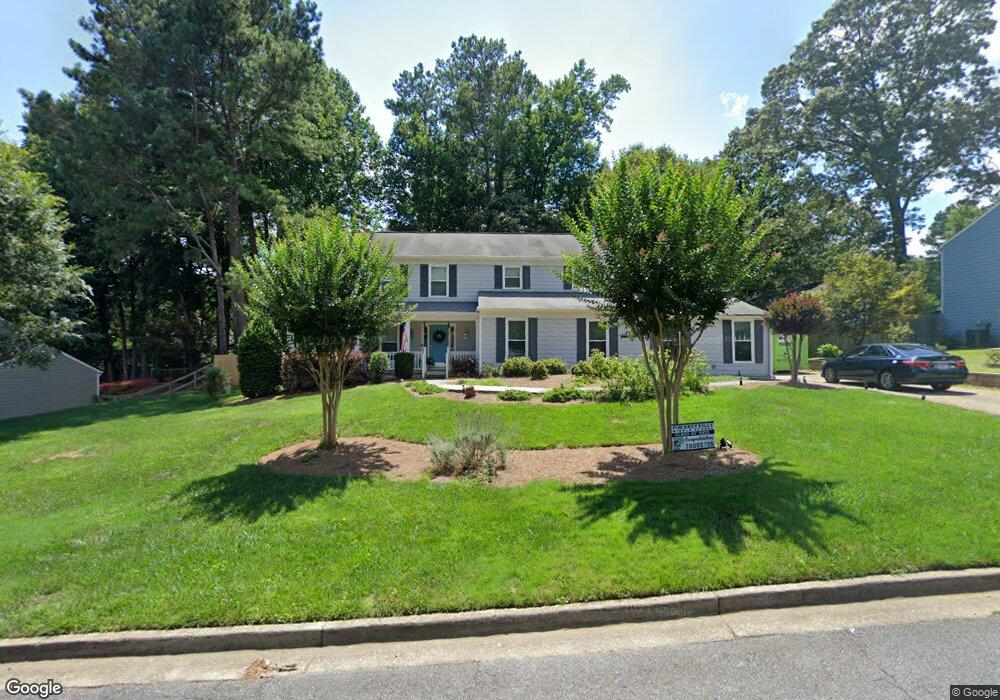
4242 Caleb Ct Norcross, GA 30092
Estimated Value: $424,000 - $562,000
4
Beds
3
Baths
2,592
Sq Ft
$193/Sq Ft
Est. Value
About This Home
This home is located at 4242 Caleb Ct, Norcross, GA 30092 and is currently estimated at $499,654, approximately $192 per square foot. 4242 Caleb Ct is a home located in Gwinnett County with nearby schools including Simpson Elementary School, Pinckneyville Middle School, and Norcross High School.
Ownership History
Date
Name
Owned For
Owner Type
Purchase Details
Closed on
Jun 14, 2021
Sold by
Laponzina Michael
Bought by
Kennel Ian J and Kennel Natalie A
Current Estimated Value
Home Financials for this Owner
Home Financials are based on the most recent Mortgage that was taken out on this home.
Original Mortgage
$298,760
Outstanding Balance
$270,490
Interest Rate
2.9%
Mortgage Type
New Conventional
Estimated Equity
$229,164
Purchase Details
Closed on
Oct 17, 2014
Sold by
Banathy Natalie
Bought by
Laponzina Michael and Laponzina Nancy
Purchase Details
Closed on
Nov 22, 2011
Sold by
Laponzina Michael R
Bought by
Laponzina Michael and Banathy Natalie
Create a Home Valuation Report for This Property
The Home Valuation Report is an in-depth analysis detailing your home's value as well as a comparison with similar homes in the area
Home Values in the Area
Average Home Value in this Area
Purchase History
| Date | Buyer | Sale Price | Title Company |
|---|---|---|---|
| Kennel Ian J | $308,000 | -- | |
| Laponzina Michael | -- | -- | |
| Laponzina Michael | -- | -- |
Source: Public Records
Mortgage History
| Date | Status | Borrower | Loan Amount |
|---|---|---|---|
| Open | Kennel Ian J | $298,760 |
Source: Public Records
Tax History Compared to Growth
Tax History
| Year | Tax Paid | Tax Assessment Tax Assessment Total Assessment is a certain percentage of the fair market value that is determined by local assessors to be the total taxable value of land and additions on the property. | Land | Improvement |
|---|---|---|---|---|
| 2024 | $6,393 | $192,000 | $36,400 | $155,600 |
| 2023 | $6,393 | $207,280 | $36,400 | $170,880 |
| 2022 | $4,426 | $123,200 | $32,800 | $90,400 |
| 2021 | $6,099 | $161,720 | $26,240 | $135,480 |
| 2020 | $924 | $156,320 | $26,000 | $130,320 |
| 2019 | $4,874 | $156,320 | $26,000 | $130,320 |
| 2018 | $4,631 | $144,320 | $24,000 | $120,320 |
| 2016 | $3,885 | $111,880 | $24,000 | $87,880 |
| 2015 | $3,929 | $111,880 | $24,000 | $87,880 |
| 2014 | $3,736 | $107,920 | $24,000 | $83,920 |
Source: Public Records
Map
Nearby Homes
- 5440 Clinchfield Trail
- 5350 Wickershire Dr
- 5221 W Jones Bridge Rd
- 5545 Fitzpatrick Terrace
- 5397 Valley Mist Ct
- 5465 Fort Fisher Way
- 5465 Fort Fisher Way
- 4531 Outer Bank Dr
- 5649 Whitesburg Ct
- 5354 Fox Hill Dr
- 5885 Match Point
- 5863 Revington Dr
- 5201 Edgerton Dr
- 5206 Creek Walk Cir
- 4916 Sudbrook Way Unit 253
- The Adams Plan at Waterside - Condos
- 4457 Watervale Way Unit 292
- 4477 Watervale Way Unit 286
- 5047 Shirley Oaks Dr Unit 313
- 4903 Sudbrook Way Unit 239
- 0 Caleb Ct Unit 7179049
- 0 Caleb Ct Unit 8498555
- 0 Caleb Ct Unit 8807826
- 0 Caleb Ct Unit 8779911
- 0 Caleb Ct
- 4232 Caleb Ct
- 4252 Caleb Ct
- 4741 Jones Bridge Cir
- 4241 Caleb Ct
- 4150 Mary Walk
- 4160 Mary Walk
- 4231 Caleb Ct
- 4251 Caleb Ct Unit 10
- 4731 Jones Bridge Cir
- 4222 Caleb Ct Unit 10
- 4799 Jones Bridge Cir
- 4221 Caleb Ct
- 4170 Mary Walk
- 4721 Jones Bridge Cir
- 4212 Caleb Ct