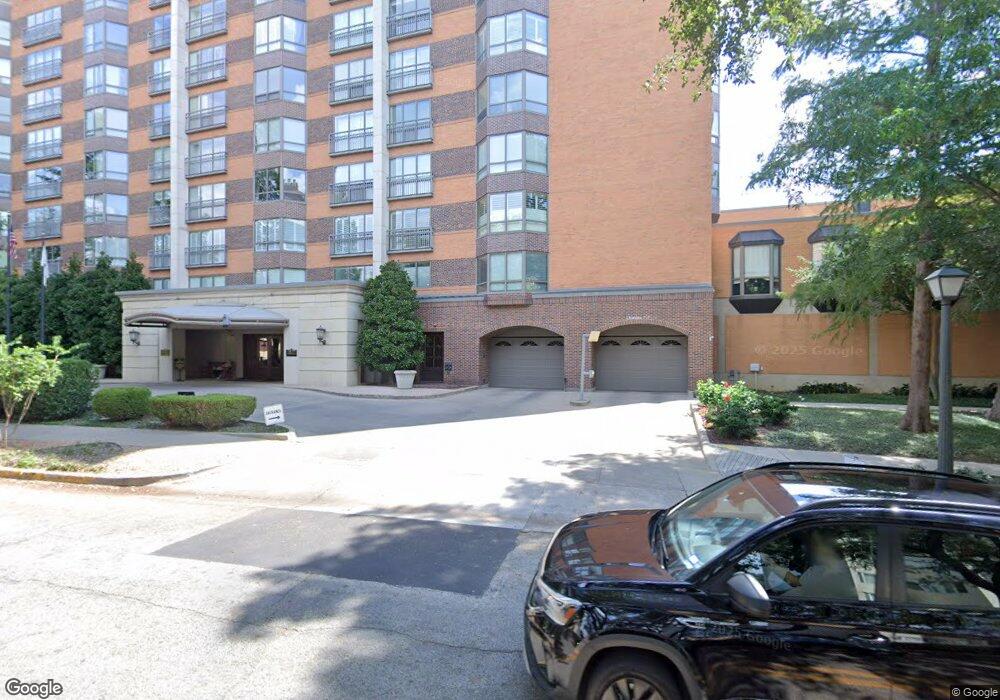
4242 Lomo Alto Dr, Unit N57 Dallas, TX 75219
Estimated Value: $355,044 - $510,000
1
Bed
2
Baths
1,063
Sq Ft
$396/Sq Ft
Est. Value
About This Home
This home is located at 4242 Lomo Alto Dr Unit N57, Dallas, TX 75219 and is currently estimated at $420,511, approximately $395 per square foot. 4242 Lomo Alto Dr Unit N57 is a home located in Dallas County with nearby schools including Ben Milam Elementary School, Alex W. Spence Talented/Gifted Academy, and North Dallas High School.
Ownership History
Date
Name
Owned For
Owner Type
Purchase Details
Closed on
Jan 28, 2017
Sold by
Stancliffe Jane Scott
Bought by
Kimple Patsy
Current Estimated Value
Purchase Details
Closed on
Jun 28, 2009
Sold by
Bagwell John C and Bagwell Jane C
Bought by
Stancliffe Jane Scott
Purchase Details
Closed on
May 22, 2006
Sold by
Modory Stephen M and Modory Elizabeth A
Bought by
Bagwell John C and Bagwell Jane C
Home Financials for this Owner
Home Financials are based on the most recent Mortgage that was taken out on this home.
Original Mortgage
$155,200
Interest Rate
6.5%
Mortgage Type
Fannie Mae Freddie Mac
Purchase Details
Closed on
Mar 17, 2000
Sold by
The Crestpark Ltd
Bought by
Modory Stephen M and Modory Elizabeth A
Home Financials for this Owner
Home Financials are based on the most recent Mortgage that was taken out on this home.
Original Mortgage
$141,600
Interest Rate
8.36%
Create a Home Valuation Report for This Property
The Home Valuation Report is an in-depth analysis detailing your home's value as well as a comparison with similar homes in the area
Home Values in the Area
Average Home Value in this Area
Purchase History
| Date | Buyer | Sale Price | Title Company |
|---|---|---|---|
| Kimple Patsy | -- | None Available | |
| Stancliffe Jane Scott | -- | Chicago Title Insurane Co | |
| Bagwell John C | -- | None Available | |
| Modory Stephen M | -- | -- |
Source: Public Records
Mortgage History
| Date | Status | Borrower | Loan Amount |
|---|---|---|---|
| Previous Owner | Bagwell John C | $155,200 | |
| Previous Owner | Modory Stephen M | $141,600 |
Source: Public Records
Tax History Compared to Growth
Tax History
| Year | Tax Paid | Tax Assessment Tax Assessment Total Assessment is a certain percentage of the fair market value that is determined by local assessors to be the total taxable value of land and additions on the property. | Land | Improvement |
|---|---|---|---|---|
| 2025 | $1,885 | $334,850 | $56,370 | $278,480 |
| 2024 | $1,885 | $334,850 | $56,370 | $278,480 |
| 2023 | $1,885 | $287,010 | $53,240 | $233,770 |
| 2022 | $5,388 | $287,010 | $53,240 | $233,770 |
| 2021 | $5,465 | $276,380 | $53,240 | $223,140 |
| 2020 | $4,836 | $239,180 | $53,240 | $185,940 |
| 2019 | $5,725 | $271,070 | $53,240 | $217,830 |
| 2018 | $5,085 | $244,490 | $43,840 | $200,650 |
| 2017 | $4,957 | $244,490 | $43,840 | $200,650 |
| 2016 | $4,663 | $230,000 | $43,840 | $186,160 |
| 2015 | $3,686 | $215,790 | $43,840 | $171,950 |
| 2014 | $3,686 | $184,130 | $37,580 | $146,550 |
Source: Public Records
About This Building
Map
Nearby Homes
- 4242 Lomo Alto Dr Unit N96
- 4242 Lomo Alto Dr Unit N93
- 4242 Lomo Alto Dr Unit N12
- 4500 Roland Ave Unit 801
- 4511 Gilbert Ave Unit 108
- 4511 Gilbert Ave Unit 106
- 4507 Holland Ave Unit 107B
- 3805 Prescott Ave Unit A
- 4503 Holland Ave
- 3627 Prescott Ave
- 3909 Hawthorne Ave Unit 102
- 4434 Holland Ave Unit C
- 4545 Bowser Ave Unit 204
- 4541 Westway Ave
- 3921 Hawthorne Ave
- 3930 Hawthorne Ave
- 4445 Rheims Place
- 3519 Prescott Ave
- 4544 Westway Ave
- 3939 Hawthorne Ave Unit 102
- 4242 Lomo Alto Dr Unit N88
- 4242 Lomo Alto Dr Unit N104
- 4242 Lomo Alto Dr Unit N98
- 4242 Lomo Alto Dr Unit N78
- 4242 Lomo Alto Dr Unit N68
- 4242 Lomo Alto Dr Unit N58
- 4242 Lomo Alto Dr Unit N48
- 4242 Lomo Alto Dr Unit N38
- 4242 Lomo Alto Dr Unit N26
- 4242 Lomo Alto Dr Unit N86
- 4242 Lomo Alto Dr Unit N76
- 4242 Lomo Alto Dr Unit N24
- 4242 Lomo Alto Dr Unit N37
- 4242 Lomo Alto Dr Unit W22
- 4242 Lomo Alto Dr Unit N52
- 4242 Lomo Alto Dr Unit N73
- 4242 Lomo Alto Dr Unit N81
- 4242 Lomo Alto Dr Unit N87
- 4242 Lomo Alto Dr Unit N34
- 4242 Lomo Alto Dr Unit N64