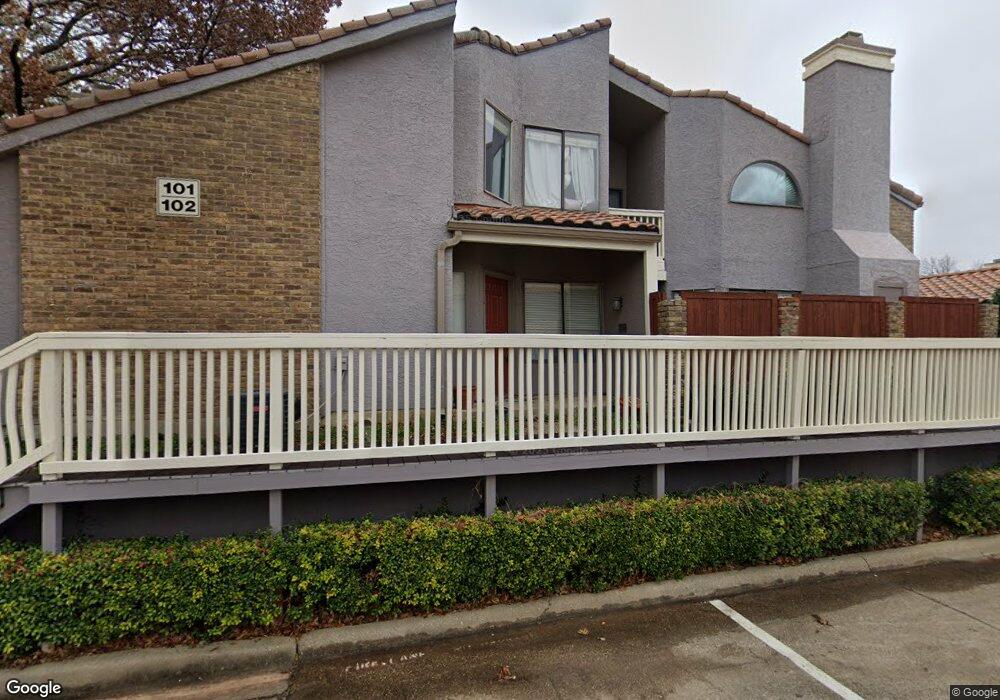
4242 N Capistrano Dr Unit 170 Dallas, TX 75287
Far North Dallas NeighborhoodEstimated Value: $279,000 - $310,106
2
Beds
2
Baths
1,519
Sq Ft
$195/Sq Ft
Est. Value
About This Home
This home is located at 4242 N Capistrano Dr Unit 170, Dallas, TX 75287 and is currently estimated at $295,527, approximately $194 per square foot. 4242 N Capistrano Dr Unit 170 is a home located in Collin County with nearby schools including Mitchell Elementary School, Frankford Middle, and Shepton High School.
Ownership History
Date
Name
Owned For
Owner Type
Purchase Details
Closed on
Jan 28, 2009
Sold by
Do Thuy
Bought by
Pitts Diana
Current Estimated Value
Home Financials for this Owner
Home Financials are based on the most recent Mortgage that was taken out on this home.
Original Mortgage
$142,373
Outstanding Balance
$89,949
Interest Rate
5.09%
Mortgage Type
FHA
Estimated Equity
$205,578
Purchase Details
Closed on
Jan 30, 2003
Sold by
Aman Edward D and Aman Nancy S
Bought by
Do Thuy
Home Financials for this Owner
Home Financials are based on the most recent Mortgage that was taken out on this home.
Original Mortgage
$108,880
Interest Rate
5.9%
Purchase Details
Closed on
Jul 22, 1999
Sold by
Villas At Parkway Villages Lp
Bought by
Aman Edward D and Aman Nancy S
Home Financials for this Owner
Home Financials are based on the most recent Mortgage that was taken out on this home.
Original Mortgage
$86,000
Interest Rate
7.63%
Create a Home Valuation Report for This Property
The Home Valuation Report is an in-depth analysis detailing your home's value as well as a comparison with similar homes in the area
Home Values in the Area
Average Home Value in this Area
Purchase History
| Date | Buyer | Sale Price | Title Company |
|---|---|---|---|
| Pitts Diana | -- | Stnt | |
| Do Thuy | -- | Chicago Title | |
| Aman Edward D | -- | -- |
Source: Public Records
Mortgage History
| Date | Status | Borrower | Loan Amount |
|---|---|---|---|
| Open | Pitts Diana | $142,373 | |
| Previous Owner | Do Thuy | $108,880 | |
| Previous Owner | Aman Edward D | $86,000 | |
| Closed | Do Thuy | $27,220 |
Source: Public Records
Tax History Compared to Growth
Tax History
| Year | Tax Paid | Tax Assessment Tax Assessment Total Assessment is a certain percentage of the fair market value that is determined by local assessors to be the total taxable value of land and additions on the property. | Land | Improvement |
|---|---|---|---|---|
| 2025 | $2,789 | $292,209 | $95,000 | $197,209 |
| 2024 | $2,789 | $286,649 | $95,000 | $224,747 |
| 2023 | $2,789 | $260,590 | $85,000 | $196,075 |
| 2022 | $5,305 | $236,900 | $65,000 | $181,759 |
| 2021 | $5,047 | $215,364 | $55,000 | $160,364 |
| 2020 | $4,998 | $210,878 | $50,000 | $160,878 |
| 2019 | $5,225 | $210,863 | $50,000 | $164,317 |
| 2018 | $4,776 | $191,694 | $45,000 | $146,694 |
| 2017 | $4,484 | $179,978 | $35,000 | $144,978 |
| 2016 | $4,113 | $163,800 | $20,000 | $143,800 |
| 2015 | $2,657 | $151,547 | $20,000 | $131,547 |
Source: Public Records
Map
Nearby Homes
- 4242 N Capistrano Dr Unit 181
- 4242 N Capistrano Dr Unit 175
- 4242 N Capistrano Dr Unit 235
- 4316 N Capistrano Dr
- 18915 Waterway Rd
- 18625 Tall Oak Dr
- 4247 Millview Ln
- 4256 Peppermill Ln
- 4232 Briarbend Rd
- 18940 Misthaven Place
- 18545 Vista Del Sol Dr
- 4236 Winding Way Ct
- 4223 Lawngate Dr
- 4047 Briarbend Rd
- 18944 Ravenglen Ct
- 4056 Windhaven Ln
- 18515 Park Grove Ln
- 4020 Windhaven Ln
- 18851 Park Grove Ln
- 18403 Gibbons Dr
- 4242 N Capistrano Dr Unit 233
- 4242 N Capistrano Dr Unit 118
- 4242 N Capistrano Dr Unit 167
- 4242 N Capistrano Dr Unit 130
- 4242 N Capistrano Dr Unit 187
- 4242 N Capistrano Dr Unit 104
- 4242 N Capistrano Dr Unit 140
- 4242 N Capistrano Dr Unit 110
- 4242 N Capistrano Dr Unit 178
- 4242 N Capistrano Dr Unit 162
- 4242 N Capistrano Dr Unit 198
- 4242 N Capistrano Dr Unit 156
- 4242 N Capistrano Dr Unit 203
- 4242 N Capistrano Dr Unit 106
- 4242 N Capistrano Dr Unit 116
- 4242 N Capistrano Dr Unit 108
- 4242 N Capistrano Dr Unit 225
- 4242 N Capistrano Dr Unit 163
- 4242 N Capistrano Dr Unit 224
- 4242 N Capistrano Dr Unit 209