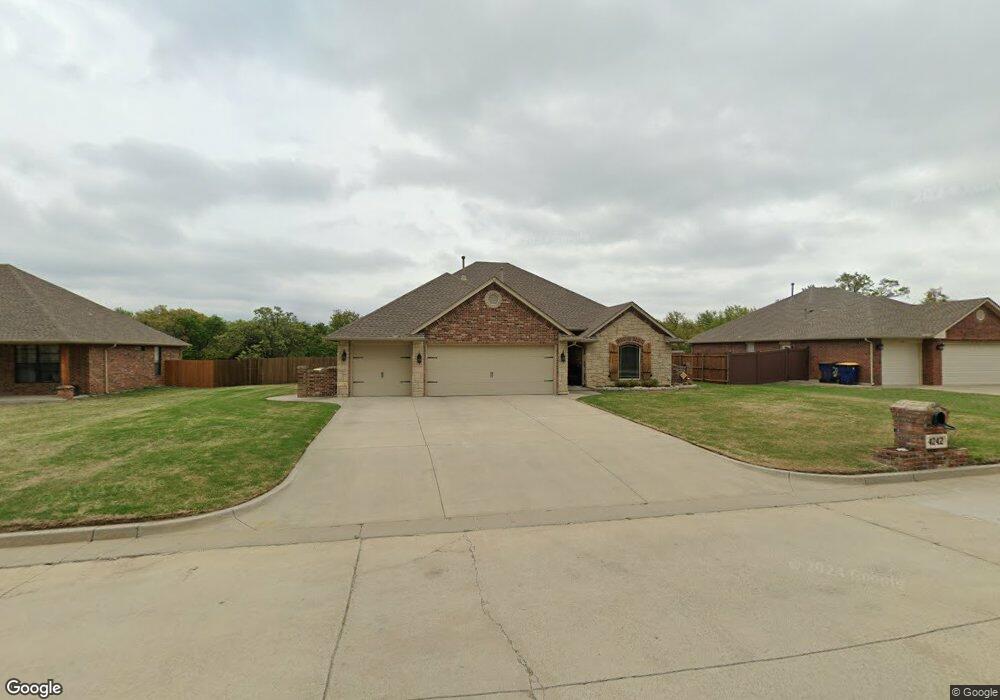
4242 Red Fox Rd Choctaw, OK 73020
Estimated Value: $330,687 - $349,000
3
Beds
2
Baths
1,945
Sq Ft
$176/Sq Ft
Est. Value
About This Home
This home is located at 4242 Red Fox Rd, Choctaw, OK 73020 and is currently estimated at $342,672, approximately $176 per square foot. 4242 Red Fox Rd is a home located in Oklahoma County with nearby schools including Choctaw Elementary School, Choctaw Middle School, and Choctaw High School.
Ownership History
Date
Name
Owned For
Owner Type
Purchase Details
Closed on
Feb 28, 2023
Sold by
Wilkerson Danah H and Wilkerson Renata L
Bought by
Wilkerson Danah H and Wilkerson Renata L
Current Estimated Value
Purchase Details
Closed on
Dec 18, 2009
Sold by
Priced Rite Inc
Bought by
Wilkerson Dana H and Wilkerson Renata L
Home Financials for this Owner
Home Financials are based on the most recent Mortgage that was taken out on this home.
Original Mortgage
$85,000
Interest Rate
4.9%
Mortgage Type
New Conventional
Purchase Details
Closed on
Jun 5, 2009
Sold by
Midco Development Company Inc
Bought by
Priced Rite Inc
Home Financials for this Owner
Home Financials are based on the most recent Mortgage that was taken out on this home.
Original Mortgage
$153,000
Interest Rate
4.72%
Mortgage Type
Purchase Money Mortgage
Create a Home Valuation Report for This Property
The Home Valuation Report is an in-depth analysis detailing your home's value as well as a comparison with similar homes in the area
Home Values in the Area
Average Home Value in this Area
Purchase History
| Date | Buyer | Sale Price | Title Company |
|---|---|---|---|
| Wilkerson Danah H | -- | None Listed On Document | |
| Wilkerson Dana H | $184,000 | Stewart Escrow & Title Midwe | |
| Priced Rite Inc | $30,000 | Stewart Escrow & Title Midwe |
Source: Public Records
Mortgage History
| Date | Status | Borrower | Loan Amount |
|---|---|---|---|
| Previous Owner | Wilkerson Dana H | $85,000 | |
| Previous Owner | Priced Rite Inc | $153,000 |
Source: Public Records
Tax History Compared to Growth
Tax History
| Year | Tax Paid | Tax Assessment Tax Assessment Total Assessment is a certain percentage of the fair market value that is determined by local assessors to be the total taxable value of land and additions on the property. | Land | Improvement |
|---|---|---|---|---|
| 2024 | $3,355 | $29,837 | $5,606 | $24,231 |
| 2023 | $3,302 | $28,967 | $5,548 | $23,419 |
| 2022 | $3,150 | $28,124 | $6,297 | $21,827 |
| 2021 | $3,056 | $27,305 | $6,388 | $20,917 |
| 2020 | $2,980 | $26,510 | $6,664 | $19,846 |
| 2019 | $2,918 | $25,957 | $6,406 | $19,551 |
| 2018 | $2,838 | $25,201 | $0 | $0 |
| 2017 | $2,675 | $23,862 | $5,579 | $18,283 |
| 2016 | $2,608 | $23,167 | $5,618 | $17,549 |
| 2015 | $2,532 | $22,493 | $5,526 | $16,967 |
| 2014 | $2,480 | $21,838 | $5,554 | $16,284 |
Source: Public Records
Map
Nearby Homes
- 15243 Red Stone Rd
- 15174 Gray Fox Rd
- 3995 N McDonald Rd
- 0 N Choctaw Rd
- 3501 Elizabeth St
- 2896 Clarke St
- 2465 Maupin St
- 2400 Harper Rd
- 14029 N Ridge Dr
- 3460 N Ridge Dr
- 14117 N Ridge Dr
- 14248 N Ridge Dr
- 0 NE 36th St
- 2580 Main St
- 14028 N Ridge Dr
- 13410 NE 23rd St
- 00000 NE 23rd St
- 2520 Hawkins St
- 6001 Sandyhill Rd
- 14709 Chisholm Trail
- 4200 Red Fox Rd
- 4274 Red Fox Rd
- 4306 Red Fox Rd
- 15288 Fox Creek Rd
- 15281 Fox Creek Rd
- 4176 Red Fox Rd
- 4330 Red Fox Rd
- 15267 Red Stone Rd
- 15252 Fox Creek Rd
- 15276 Fox Hollow Rd
- 15247 Fox Creek Rd
- 4152 Red Fox Rd
- 15208 Fox Creek Rd
- 15246 Fox Hollow Rd
- 15213 Fox Creek Rd
- 15219 Red Stone Rd
- 15266 Red Stone Rd
- 15218 Fox Hollow Rd
- 15182 Fox Creek Rd