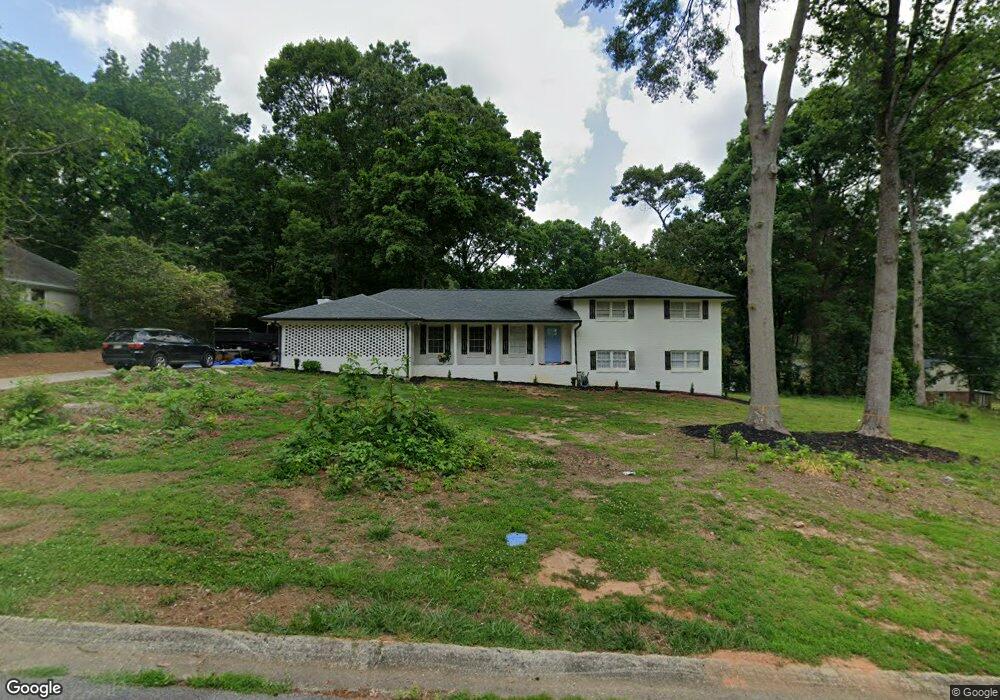
4243 Dorsey Ct SW Unit 6/29 Lilburn, GA 30047
Estimated Value: $403,497 - $417,000
4
Beds
3
Baths
1,689
Sq Ft
$244/Sq Ft
Est. Value
About This Home
This home is located at 4243 Dorsey Ct SW Unit 6/29, Lilburn, GA 30047 and is currently estimated at $412,874, approximately $244 per square foot. 4243 Dorsey Ct SW Unit 6/29 is a home located in Gwinnett County with nearby schools including Knight Elementary School, Trickum Middle School, and Parkview High School.
Ownership History
Date
Name
Owned For
Owner Type
Purchase Details
Closed on
Feb 21, 2025
Sold by
Antunez Maricruz
Bought by
Flores Marvin F Morales and Flores Alba A
Current Estimated Value
Home Financials for this Owner
Home Financials are based on the most recent Mortgage that was taken out on this home.
Original Mortgage
$7,500
Outstanding Balance
$6,644
Interest Rate
6.96%
Mortgage Type
New Conventional
Estimated Equity
$406,230
Purchase Details
Closed on
Dec 1, 2017
Sold by
Antunez Maricruz
Bought by
Antunez Maricruz and Antunez De Gante Isaac
Home Financials for this Owner
Home Financials are based on the most recent Mortgage that was taken out on this home.
Original Mortgage
$191,468
Interest Rate
4.12%
Mortgage Type
FHA
Purchase Details
Closed on
Mar 5, 2002
Sold by
Heredia Melesio
Bought by
Heredia Melesio
Home Financials for this Owner
Home Financials are based on the most recent Mortgage that was taken out on this home.
Original Mortgage
$166,200
Interest Rate
6.98%
Mortgage Type
New Conventional
Create a Home Valuation Report for This Property
The Home Valuation Report is an in-depth analysis detailing your home's value as well as a comparison with similar homes in the area
Home Values in the Area
Average Home Value in this Area
Purchase History
| Date | Buyer | Sale Price | Title Company |
|---|---|---|---|
| Flores Marvin F Morales | $415,000 | -- | |
| Antunez Maricruz | $195,000 | -- | |
| Antunez Maricruz | $195,000 | -- | |
| Heredia Melesio | -- | -- | |
| Heredia Melesio | $175,000 | -- |
Source: Public Records
Mortgage History
| Date | Status | Borrower | Loan Amount |
|---|---|---|---|
| Open | Flores Marvin F Morales | $7,500 | |
| Open | Flores Marvin F Morales | $394,250 | |
| Previous Owner | Antunez Maricruz | $191,468 | |
| Previous Owner | Heredia Melesio | $166,200 |
Source: Public Records
Tax History Compared to Growth
Tax History
| Year | Tax Paid | Tax Assessment Tax Assessment Total Assessment is a certain percentage of the fair market value that is determined by local assessors to be the total taxable value of land and additions on the property. | Land | Improvement |
|---|---|---|---|---|
| 2025 | $5,955 | $157,320 | $30,000 | $127,320 |
| 2024 | $5,115 | $131,720 | $30,000 | $101,720 |
| 2023 | $5,115 | $143,320 | $25,600 | $117,720 |
| 2022 | $4,460 | $114,720 | $25,600 | $89,120 |
| 2021 | $3,847 | $96,280 | $17,600 | $78,680 |
| 2020 | $3,682 | $91,160 | $17,600 | $73,560 |
| 2019 | $3,458 | $88,600 | $17,600 | $71,000 |
| 2018 | $3,088 | $78,000 | $14,400 | $63,600 |
| 2016 | $2,421 | $58,480 | $14,400 | $44,080 |
| 2015 | $2,179 | $51,000 | $8,000 | $43,000 |
| 2014 | $2,190 | $51,000 | $8,000 | $43,000 |
Source: Public Records
Map
Nearby Homes
- 676 Killian Hill Rd SW
- 551 Killian Hill Rd SW
- 4307 Cedar Wood Dr SW
- 4245 Cedar Creek Trail SW
- 565 James St SW Unit 10
- 4254 Cedar Creek Trail SW Unit 8
- 753 Brookwood Terrace SW
- 478 Dorsey Cir SW
- 871 Cedar Trace SW
- 772 Brookwood Terrace SW
- 4367 Cedar Wood Dr SW
- 4406 Hale Dr SW
- 445 Bruce Way SW
- 453 James St SW
- 383 Ben Ave SW
- 4271 Weston Dr SW
- 5453 Plain Field Ln
- 603 Dorsey Cir SW
- 0 Dorsey Ct SW Unit 8622376
- 4253 Dorsey Ct SW
- 597 Dorsey Cir SW
- 618 Dorsey Cir SW Unit 6
- 620 Dorsey Cir SW
- 4254 Dorsey Ct SW
- 604 Dorsey Cir SW
- 4263 Dorsey Ct SW
- 645 Dorsey Cir SW
- 587 Dorsey Cir SW
- 634 Dorsey Cir SW
- 592 Ben Ct SW
- 598 Dorsey Cir SW
- 4264 Dorsey Ct SW Unit 6
- 4273 Dorsey Ct SW
- 640 Dorsey Cir SW Unit 6
- 588 Dorsey Cir SW Unit 3
- 577 Dorsey Cir SW Unit 25
- 577 Dorsey Cir SW