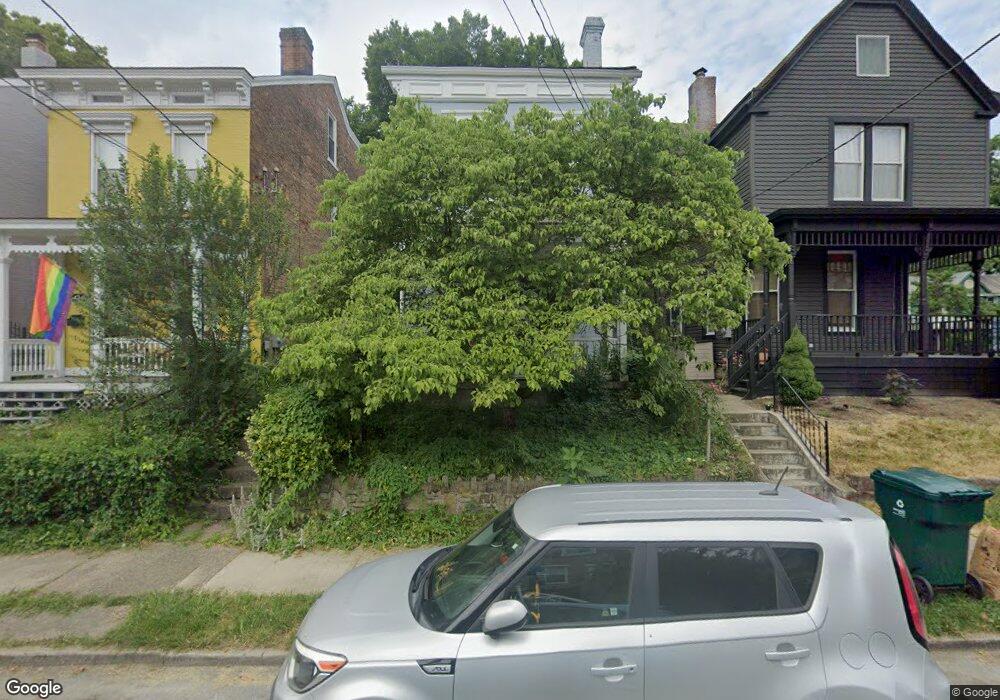
4243 Langland St Cincinnati, OH 45223
Northside NeighborhoodEstimated Value: $254,230 - $420,000
4
Beds
2
Baths
2,228
Sq Ft
$161/Sq Ft
Est. Value
About This Home
This home is located at 4243 Langland St, Cincinnati, OH 45223 and is currently estimated at $358,558, approximately $160 per square foot. 4243 Langland St is a home located in Hamilton County with nearby schools including Chase Elementary School, Robert A. Taft Information Technology High School, and Western Hills High School.
Ownership History
Date
Name
Owned For
Owner Type
Purchase Details
Closed on
May 26, 2017
Sold by
Havens Brenda
Bought by
Havens John E and Havens Brenda S
Current Estimated Value
Home Financials for this Owner
Home Financials are based on the most recent Mortgage that was taken out on this home.
Original Mortgage
$75,000
Outstanding Balance
$49,869
Interest Rate
3.97%
Mortgage Type
Unknown
Estimated Equity
$308,689
Create a Home Valuation Report for This Property
The Home Valuation Report is an in-depth analysis detailing your home's value as well as a comparison with similar homes in the area
Home Values in the Area
Average Home Value in this Area
Purchase History
| Date | Buyer | Sale Price | Title Company |
|---|---|---|---|
| Havens John E | $100,000 | None Available |
Source: Public Records
Mortgage History
| Date | Status | Borrower | Loan Amount |
|---|---|---|---|
| Open | Havens John E | $75,000 |
Source: Public Records
Tax History
| Year | Tax Paid | Tax Assessment Tax Assessment Total Assessment is a certain percentage of the fair market value that is determined by local assessors to be the total taxable value of land and additions on the property. | Land | Improvement |
|---|---|---|---|---|
| 2025 | $3,828 | $60,358 | $12,261 | $48,097 |
| 2024 | $3,823 | $60,358 | $12,261 | $48,097 |
| 2023 | $3,830 | $60,358 | $12,261 | $48,097 |
| 2022 | $2,472 | $35,000 | $5,334 | $29,666 |
| 2021 | $2,428 | $35,000 | $5,334 | $29,666 |
| 2020 | $2,435 | $35,000 | $5,334 | $29,666 |
| 2019 | $2,674 | $35,000 | $5,334 | $29,666 |
| 2018 | $2,676 | $35,000 | $5,334 | $29,666 |
| 2017 | $2,578 | $35,000 | $5,334 | $29,666 |
| 2016 | $2,249 | $29,782 | $5,198 | $24,584 |
| 2015 | $2,011 | $29,782 | $5,198 | $24,584 |
| 2014 | $2,021 | $29,782 | $5,198 | $24,584 |
| 2013 | $1,940 | $28,095 | $4,904 | $23,191 |
Source: Public Records
Map
Nearby Homes
- 4262 Langland St
- 4236 Brookside Ave
- 4235 Brookside Ave
- 4208 Brookside Ave
- 4326 Hamilton Ave
- 4153 Langland St
- 4210 Turrill St
- 4215 Turrill St
- 1324 Apjones St
- 4214 Chambers St
- 4392 Hamilton Ave
- 4125 Chambers St
- 1649 Glen Parker Ave
- 4135 Lakeman St
- 1610 Glen Parker Ave
- 1668 Glen Parker Ave
- 1764 Chase Ave
- 1743 Hanfield St
- 4556 Hamilton Ave
- 4114 Gordon St
- 4245 Langland St
- 4241 Langland St
- 4239 Langland St
- 4238 Brookside Ave
- 4234 Brookside Ave
- 4233 Langland St
- 4232 Brookside Ave
- 4240 Brookside Ave
- 4253 Langland St
- 4230 Brookside Ave
- 4244 Langland St
- 4242 Langland St
- 4246 Langland St
- 4240 Langland St
- 4231 Langland St
- 4244 Brookside Ave
- 4248 Langland St
- 4228 Brookside Ave
- 4255 Langland St
- 4229 Langland St
Your Personal Tour Guide
Ask me questions while you tour the home.