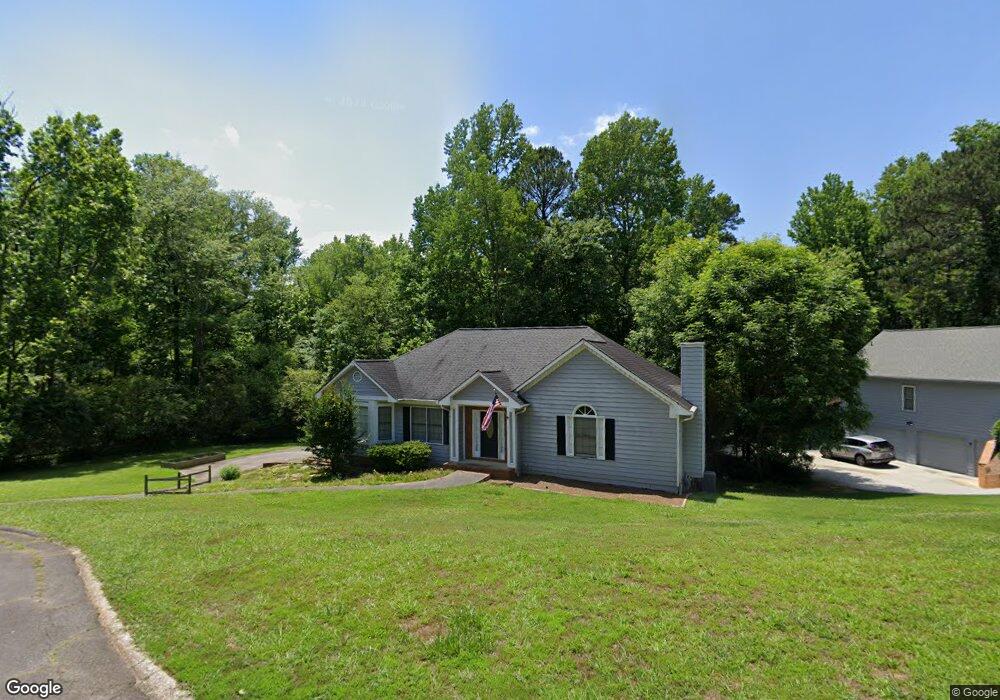
4243 W Mill Trail NW Unit 2 Kennesaw, GA 30152
West Cobb NeighborhoodEstimated Value: $300,000 - $403,000
3
Beds
2
Baths
1,688
Sq Ft
$213/Sq Ft
Est. Value
About This Home
This home is located at 4243 W Mill Trail NW Unit 2, Kennesaw, GA 30152 and is currently estimated at $360,117, approximately $213 per square foot. 4243 W Mill Trail NW Unit 2 is a home located in Cobb County with nearby schools including Due West Elementary School, Mcclure Middle School, and Harrison High School.
Ownership History
Date
Name
Owned For
Owner Type
Purchase Details
Closed on
Jul 9, 2008
Sold by
Veterans Admn
Bought by
Burton Allan
Current Estimated Value
Purchase Details
Closed on
Aug 7, 2007
Sold by
Wells Fargo Bk Na
Bought by
Affairs Sec Va
Purchase Details
Closed on
Sep 17, 1999
Sold by
Thomas Barry W and Thomas Leslie L
Bought by
Hill Darrryl J
Home Financials for this Owner
Home Financials are based on the most recent Mortgage that was taken out on this home.
Original Mortgage
$141,250
Interest Rate
8.22%
Mortgage Type
VA
Purchase Details
Closed on
Jul 2, 1993
Sold by
Odonovan Edmond B Karen
Bought by
Thomas Barry W
Home Financials for this Owner
Home Financials are based on the most recent Mortgage that was taken out on this home.
Original Mortgage
$98,262
Interest Rate
7.49%
Mortgage Type
FHA
Create a Home Valuation Report for This Property
The Home Valuation Report is an in-depth analysis detailing your home's value as well as a comparison with similar homes in the area
Home Values in the Area
Average Home Value in this Area
Purchase History
| Date | Buyer | Sale Price | Title Company |
|---|---|---|---|
| Burton Allan | $132,115 | -- | |
| Affairs Sec Va | -- | -- | |
| Wells Fargo Bk Na | $149,876 | -- | |
| Hill Darrryl J | $138,500 | -- | |
| Thomas Barry W | $98,400 | -- |
Source: Public Records
Mortgage History
| Date | Status | Borrower | Loan Amount |
|---|---|---|---|
| Previous Owner | Hill Darrryl J | $141,250 | |
| Previous Owner | Thomas Barry W | $98,262 |
Source: Public Records
Tax History Compared to Growth
Tax History
| Year | Tax Paid | Tax Assessment Tax Assessment Total Assessment is a certain percentage of the fair market value that is determined by local assessors to be the total taxable value of land and additions on the property. | Land | Improvement |
|---|---|---|---|---|
| 2025 | $4,454 | $162,548 | $26,000 | $136,548 |
| 2024 | $4,289 | $142,240 | $14,000 | $128,240 |
| 2023 | $4,289 | $142,240 | $14,000 | $128,240 |
| 2022 | $3,739 | $123,180 | $14,000 | $109,180 |
| 2021 | $3,146 | $103,672 | $14,000 | $89,672 |
| 2020 | $2,592 | $85,392 | $14,000 | $71,392 |
| 2019 | $2,592 | $85,392 | $14,000 | $71,392 |
| 2018 | $2,408 | $79,356 | $14,000 | $65,356 |
| 2017 | $2,281 | $79,356 | $14,000 | $65,356 |
| 2016 | $1,948 | $67,740 | $12,000 | $55,740 |
| 2015 | $1,996 | $67,740 | $12,000 | $55,740 |
| 2014 | $1,783 | $60,016 | $0 | $0 |
Source: Public Records
Map
Nearby Homes
- 4219 W Mill Trail NW
- 1034 W Mill Dr NW Unit 1
- 978 W Mill Bend NW
- 1015 Token Way NW
- 975 W Mill Bend NW
- 4203 W Mill Trail NW
- 4120 Chanticleer Dr NW
- 1231 Fawndale Dr NW
- 4362 Rolling Oaks Ct NW
- 4100 Chanticleer Dr NW
- 0 W Pointe Dr NW Unit 10457092
- 0 W Pointe Dr NW Unit 7522802
- 4421 Wooded Oaks NW
- 4220 Rockpoint Dr NW
- 3816 Whithorn Way
- 1254 Hadaway Garden Dr NW
- 4398 Windchime Way NW
- 4241 W Mill Trail NW
- 4241 W Mill Trail NW
- 4245 W Mill Trail NW
- 4239 W Mill Trail NW
- 4240 W Mill Trail NW
- 4237 W Mill Trail NW
- 4247 W Mill Trail NW Unit 2
- 1039 Peace Dr NW Unit 1
- 4238 W Mill Trail NW Unit 1
- 4235 W Mill Trail NW
- 1035 Peace Dr NW
- 1043 Peace Dr NW Unit 1
- 1041 Peace Dr NW
- 1037 Peace Dr NW
- 4242 W Mill Trail NW
- 4236 W Mill Trail NW
- 4233 W Mill Tl
- 4233 W Mill Trail NW
- 1031 Peace Dr NW
- 1033 Peace Dr NW