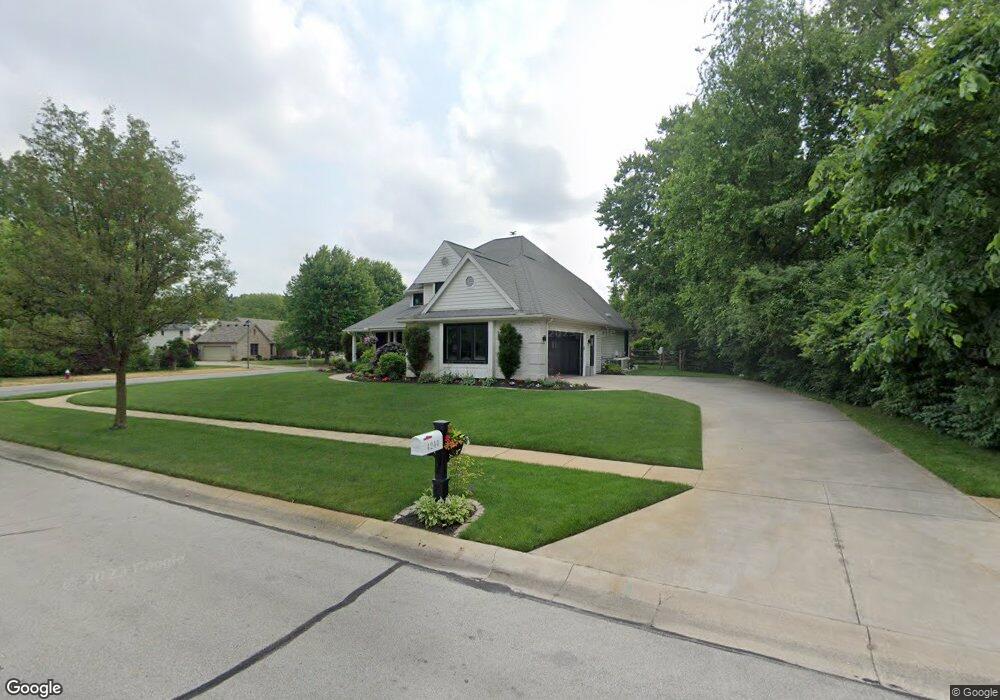
4244 Butternut Ct Sylvania, OH 43560
Estimated Value: $363,000 - $436,000
4
Beds
3
Baths
2,249
Sq Ft
$179/Sq Ft
Est. Value
About This Home
This home is located at 4244 Butternut Ct, Sylvania, OH 43560 and is currently estimated at $401,537, approximately $178 per square foot. 4244 Butternut Ct is a home located in Lucas County with nearby schools including Sylvan Elementary School, Sylvania McCord Junior High School, and Sylvania Southview High School.
Ownership History
Date
Name
Owned For
Owner Type
Purchase Details
Closed on
May 25, 2001
Sold by
Bradley Heather L
Bought by
Spangler Matthew J and Spangler Amy S
Current Estimated Value
Home Financials for this Owner
Home Financials are based on the most recent Mortgage that was taken out on this home.
Original Mortgage
$205,600
Outstanding Balance
$77,907
Interest Rate
7.23%
Estimated Equity
$323,630
Purchase Details
Closed on
Sep 30, 1998
Sold by
Orchard Hill Construction Inc
Bought by
Bradley Heather L
Home Financials for this Owner
Home Financials are based on the most recent Mortgage that was taken out on this home.
Original Mortgage
$214,250
Interest Rate
6.98%
Purchase Details
Closed on
May 27, 1997
Sold by
Louisville Title Agency
Bought by
Orchard Hill Const Inc
Home Financials for this Owner
Home Financials are based on the most recent Mortgage that was taken out on this home.
Original Mortgage
$192,000
Interest Rate
8.24%
Mortgage Type
New Conventional
Create a Home Valuation Report for This Property
The Home Valuation Report is an in-depth analysis detailing your home's value as well as a comparison with similar homes in the area
Home Values in the Area
Average Home Value in this Area
Purchase History
| Date | Buyer | Sale Price | Title Company |
|---|---|---|---|
| Spangler Matthew J | $257,000 | Louisville Title Agency For | |
| Bradley Heather L | $244,300 | Louisville Title Agency For | |
| Orchard Hill Const Inc | $38,363 | -- |
Source: Public Records
Mortgage History
| Date | Status | Borrower | Loan Amount |
|---|---|---|---|
| Open | Spangler Matthew J | $205,600 | |
| Closed | Bradley Heather L | $214,250 | |
| Previous Owner | Orchard Hill Const Inc | $192,000 |
Source: Public Records
Tax History Compared to Growth
Tax History
| Year | Tax Paid | Tax Assessment Tax Assessment Total Assessment is a certain percentage of the fair market value that is determined by local assessors to be the total taxable value of land and additions on the property. | Land | Improvement |
|---|---|---|---|---|
| 2024 | $4,415 | $139,650 | $15,365 | $124,285 |
| 2023 | $8,030 | $110,005 | $13,475 | $96,530 |
| 2022 | $8,042 | $110,005 | $13,475 | $96,530 |
| 2021 | $8,248 | $110,005 | $13,475 | $96,530 |
| 2020 | $7,800 | $92,330 | $10,920 | $81,410 |
| 2019 | $7,494 | $92,330 | $10,920 | $81,410 |
| 2018 | $7,065 | $92,330 | $10,920 | $81,410 |
| 2017 | $7,147 | $79,765 | $13,090 | $66,675 |
| 2016 | $7,006 | $227,900 | $37,400 | $190,500 |
| 2015 | $6,594 | $227,900 | $37,400 | $190,500 |
| 2014 | $6,073 | $76,720 | $12,600 | $64,120 |
| 2013 | $6,073 | $76,720 | $12,600 | $64,120 |
Source: Public Records
Map
Nearby Homes
- 4533 Gettysburg Dr
- 4610 Woodland Ln
- 7325 Winsford Ln
- 22 Shenandoah Cir
- 21 Shenandoah Cir
- 6732 5th Ave
- 4731 Weldwood Ln
- 6718 5th Ave Unit F
- 7469 Wicklow Woods Dr
- 4504 Promenade Ln
- 3800 Harrowsfield Rd
- 7428 Kings Walk Ln
- 6922 Gettysburg Dr
- 7413 Sylvania Ave
- 4761 Tamworth Rd
- 6657 Margate Blvd Unit 3
- 6640 Kingsbridge Dr Unit 4
- 4814 Sylvan Ct
- 8826 Flint Ct
- 8729 Harlow Ct
- 4234 Butternut Ct
- 7065 Pickett Dr Unit 7065
- 7065 Pickett Dr Unit E
- 7069 Pickett Dr Unit 7069
- 7069 Pickett Dr Unit F
- 7073 Pickett Dr
- 4314 Fleetwood Ln
- 4226 Butternut Ct
- 7061 Pickett Dr Unit D
- 7061 Pickett Dr Unit 7061
- 4245 Butternut Ct
- 4303 Vicksburg Dr
- 4243 Vicksburg Dr Unit 4243
- 4237 Butternut Ct
- 4229 Butternut Ct
- 4237 Vicksburg Dr
- 4311 Vicksburg Dr
- 4324 Fleetwood Ln
- 4220 Butternut Ct
- 4231 Vicksburg Dr