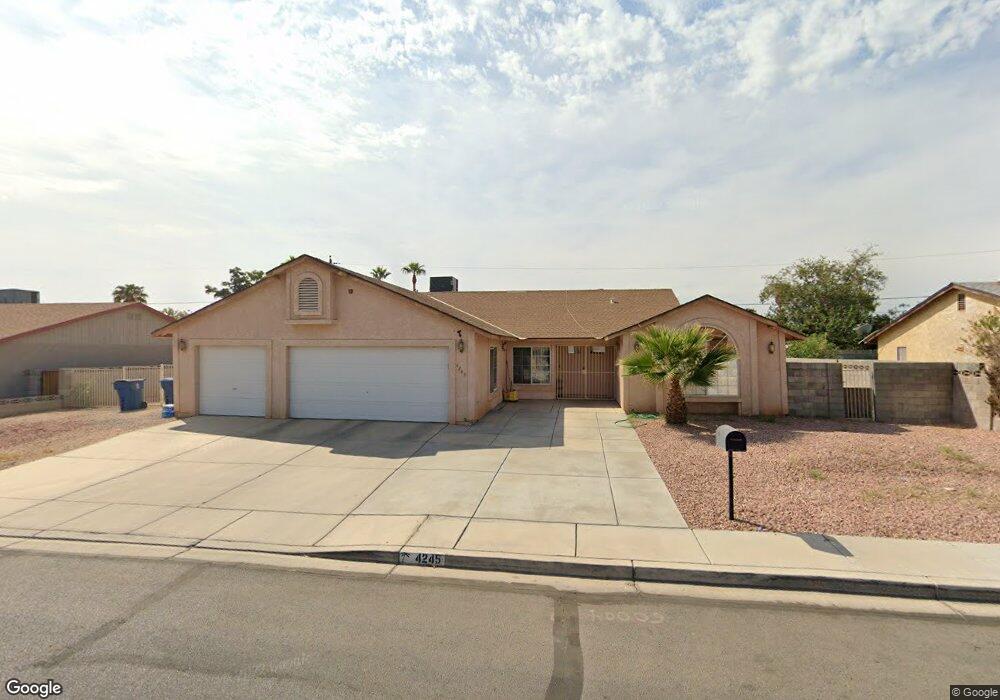
4245 E Baltimore Ave Las Vegas, NV 89104
Estimated Value: $414,955 - $484,000
4
Beds
2
Baths
1,962
Sq Ft
$234/Sq Ft
Est. Value
About This Home
This home is located at 4245 E Baltimore Ave, Las Vegas, NV 89104 and is currently estimated at $459,985, approximately $234 per square foot. 4245 E Baltimore Ave is a home located in Clark County with nearby schools including William E. Snyder Elementary School, Jerome Mack Middle School, and Chaparral High School.
Ownership History
Date
Name
Owned For
Owner Type
Purchase Details
Closed on
Aug 13, 2003
Sold by
Ortiz Magno Amalia F and Magno Jesus S
Bought by
Ortiz Magno Amalia F
Current Estimated Value
Home Financials for this Owner
Home Financials are based on the most recent Mortgage that was taken out on this home.
Original Mortgage
$162,000
Outstanding Balance
$68,110
Interest Rate
5.46%
Mortgage Type
Unknown
Estimated Equity
$391,875
Purchase Details
Closed on
Nov 5, 1996
Sold by
Malibu Development Corp
Bought by
Ortiz Amalia F and Magno Jesus S
Home Financials for this Owner
Home Financials are based on the most recent Mortgage that was taken out on this home.
Original Mortgage
$118,750
Interest Rate
7.88%
Purchase Details
Closed on
Apr 9, 1996
Sold by
Wells C Donald and Shotwell George T
Bought by
Ensueno Investments Inc
Purchase Details
Closed on
Mar 12, 1996
Sold by
Ensueno Investments Inc
Bought by
Malibu Development Corp
Create a Home Valuation Report for This Property
The Home Valuation Report is an in-depth analysis detailing your home's value as well as a comparison with similar homes in the area
Home Values in the Area
Average Home Value in this Area
Purchase History
| Date | Buyer | Sale Price | Title Company |
|---|---|---|---|
| Ortiz Magno Amalia F | -- | Old Republic Title Company | |
| Ortiz Amalia F | $125,000 | Old Republic Title Company | |
| Ensueno Investments Inc | -- | National Title Company | |
| Malibu Development Corp | $45,000 | National Title Company |
Source: Public Records
Mortgage History
| Date | Status | Borrower | Loan Amount |
|---|---|---|---|
| Open | Ortiz Magno Amalia F | $162,000 | |
| Closed | Ortiz Amalia F | $118,750 |
Source: Public Records
Tax History
| Year | Tax Paid | Tax Assessment Tax Assessment Total Assessment is a certain percentage of the fair market value that is determined by local assessors to be the total taxable value of land and additions on the property. | Land | Improvement |
|---|---|---|---|---|
| 2026 | $1,917 | $117,498 | $30,800 | $86,698 |
| 2025 | $1,775 | $94,606 | $28,875 | $65,731 |
| 2024 | $1,644 | $94,606 | $28,875 | $65,731 |
| 2023 | $1,644 | $95,387 | $32,725 | $62,662 |
| 2022 | $1,523 | $84,388 | $26,950 | $57,438 |
| 2021 | $1,410 | $77,922 | $23,100 | $54,822 |
| 2020 | $1,306 | $77,291 | $22,715 | $54,576 |
| 2019 | $1,224 | $74,899 | $21,175 | $53,724 |
| 2018 | $1,168 | $67,646 | $15,925 | $51,721 |
| 2017 | $2,006 | $68,390 | $15,925 | $52,465 |
| 2016 | $1,095 | $63,475 | $10,395 | $53,080 |
| 2015 | $1,092 | $49,259 | $8,470 | $40,789 |
| 2014 | $1,060 | $38,275 | $7,700 | $30,575 |
Source: Public Records
Map
Nearby Homes
- 4214 E Baltimore Ave
- 2294 Miner Way
- 4120 E Boston Ave
- 4411 E Boston Ave
- 4465 E Cleveland Ave
- 4064 E Philadelphia Ave
- 2209 Arden St
- 4555 E Sahara Ave Unit 254
- 4555 E Sahara Ave Unit 132
- 4555 E Sahara Ave Unit 226
- 4555 E Sahara Ave Unit 252
- 4555 E Sahara Ave Unit 146
- 4555 E Sahara Ave Unit 280
- 4555 E Sahara Ave Unit 102
- 3891 James Paul Ave
- 2018 Shannon Christine Dr
- 4679 E Cleveland Ave
- 2800 S Lamb Blvd Unit 228
- 3933 Manford Cir
- 2627 S Lamb Blvd Unit 43
- 4235 E Baltimore Ave
- 4252 E Cleveland Ave
- 4271 E Baltimore Ave
- 4234 E Cleveland Ave
- 4234 E Cleveland Ave
- 4234 E Cleveland Ave
- 4234 E Cleveland Ave
- 4234 E Cleveland Ave
- 4270 E Cleveland Ave
- 4254 E Baltimore Ave
- 4234 E Baltimore Ave
- 4270 E Baltimore Ave
- 4225 E Baltimore Ave
- 4291 E Baltimore Ave
- 4220 E Cleveland Ave
- 4290 E Cleveland Ave
- 4224 E Baltimore Ave
- 4255 E Cleveland Ave
- 4290 E Baltimore Ave
- 4255 Patterson Ave
Your Personal Tour Guide
Ask me questions while you tour the home.