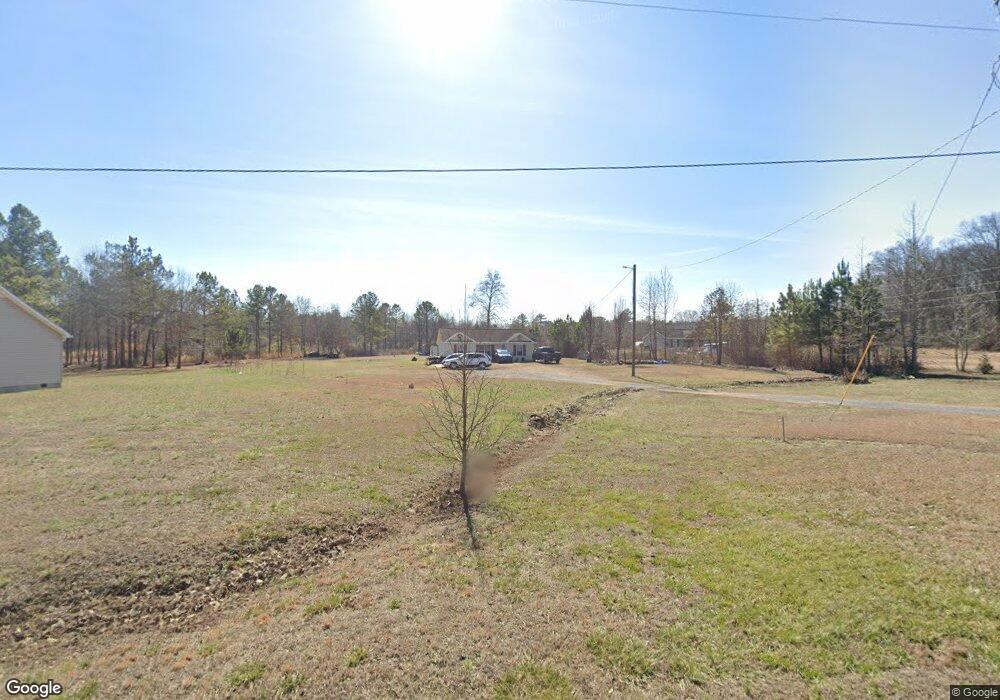
4246 Owen Rd SW Dalton, GA 30720
Estimated Value: $198,000 - $249,000
3
Beds
2
Baths
1,040
Sq Ft
$214/Sq Ft
Est. Value
About This Home
This home is located at 4246 Owen Rd SW, Dalton, GA 30720 and is currently estimated at $222,318, approximately $213 per square foot. 4246 Owen Rd SW is a home located in Whitfield County with nearby schools including Valley Point Elementary School, Valley Point Middle School, and Southeast Whitfield County High School.
Ownership History
Date
Name
Owned For
Owner Type
Purchase Details
Closed on
Jan 17, 2012
Bought by
Lopez Isabel
Current Estimated Value
Home Financials for this Owner
Home Financials are based on the most recent Mortgage that was taken out on this home.
Original Mortgage
$65,347
Outstanding Balance
$44,564
Interest Rate
3.87%
Mortgage Type
FHA
Estimated Equity
$177,754
Purchase Details
Closed on
May 3, 2011
Sold by
Regions Bank
Bought by
Secretary Of Housing
Purchase Details
Closed on
Jul 2, 2008
Sold by
Stackedstone Construction
Bought by
Perez Salvador and Rivera Eustacio
Home Financials for this Owner
Home Financials are based on the most recent Mortgage that was taken out on this home.
Original Mortgage
$116,379
Interest Rate
6.03%
Mortgage Type
FHA
Purchase Details
Closed on
Oct 31, 2007
Sold by
Not Provided
Bought by
Sec Of Housing & Urban
Purchase Details
Closed on
Jan 13, 2006
Sold by
Not Provided
Bought by
Sec Of Housing & Urban
Create a Home Valuation Report for This Property
The Home Valuation Report is an in-depth analysis detailing your home's value as well as a comparison with similar homes in the area
Home Values in the Area
Average Home Value in this Area
Purchase History
| Date | Buyer | Sale Price | Title Company |
|---|---|---|---|
| Lopez Isabel | $64,800 | -- | |
| Secretary Of Housing | $123,711 | -- | |
| Regions Bank | $123,711 | -- | |
| Perez Salvador | $117,300 | -- | |
| Sec Of Housing & Urban | -- | -- | |
| Sec Of Housing & Urban | -- | -- |
Source: Public Records
Mortgage History
| Date | Status | Borrower | Loan Amount |
|---|---|---|---|
| Open | Regions Bank | $65,347 | |
| Previous Owner | Perez Salvador | $116,379 |
Source: Public Records
Tax History Compared to Growth
Tax History
| Year | Tax Paid | Tax Assessment Tax Assessment Total Assessment is a certain percentage of the fair market value that is determined by local assessors to be the total taxable value of land and additions on the property. | Land | Improvement |
|---|---|---|---|---|
| 2024 | $1,188 | $68,584 | $16,443 | $52,141 |
| 2023 | $1,188 | $43,802 | $9,294 | $34,508 |
| 2022 | $726 | $33,160 | $7,586 | $25,574 |
| 2021 | $726 | $33,160 | $7,586 | $25,574 |
| 2020 | $739 | $33,160 | $7,586 | $25,574 |
| 2019 | $746 | $33,160 | $7,586 | $25,574 |
| 2018 | $741 | $32,810 | $7,236 | $25,574 |
| 2017 | $741 | $32,810 | $7,236 | $25,574 |
| 2016 | $605 | $28,826 | $5,566 | $23,260 |
| 2014 | $589 | $29,285 | $6,026 | $23,260 |
| 2013 | -- | $29,285 | $6,025 | $23,259 |
Source: Public Records
Map
Nearby Homes
- 674 Eber Rd SE
- 797 Carbondale Rd SW
- 662 W Nance Springs Rd SW
- 4888 Cline Rd
- 402 W Nance Springs Rd
- 0 Carbondale Rd SW Unit 130445
- 0 Carbondale Rd SW Unit 10515867
- 0 Carbondale Rd SW Unit 7574085
- 0 Carbondale Rd SW Unit 129966
- 0 Carbondale Rd SW Unit 129726
- 0 W Nance Springs Rd Unit 11580553
- 1786 Hill City Rd NW
- 4486 S Dixie Hwy
- 0 Fennel Dr
- 4381 S Dixie Hwy
- 00 S Dixie Hwy
- 702 Cline Rd
- 200 Carol Joyce Dr SE
- 207 Carol Joyce Dr SE
- 213 Gwendolyn Lee Ln
- 4258 Owen Rd SW
- 4276 Owen Rd SW
- 4141 Owen Rd SW
- 4131 Owen Rd SW
- 4121 Owen Rd SW
- 4212 Owen Rd SW
- 4292 Owen Rd SW
- 4322 Owen Rd SW
- 4281 Owen Rd SW
- 568 Eber Rd SE
- 564 Eber Rd SE
- 560 Eber Rd SE
- 544 Eber Rd SE
- 558 Eber Rd SE
- 4246 Louise Ln SW
- 610 Eber Rd SE
- 554 Eber Rd SE
- 550 Eber Rd SE
- 556 Eber Rd SE
- 552 Eber Rd SE