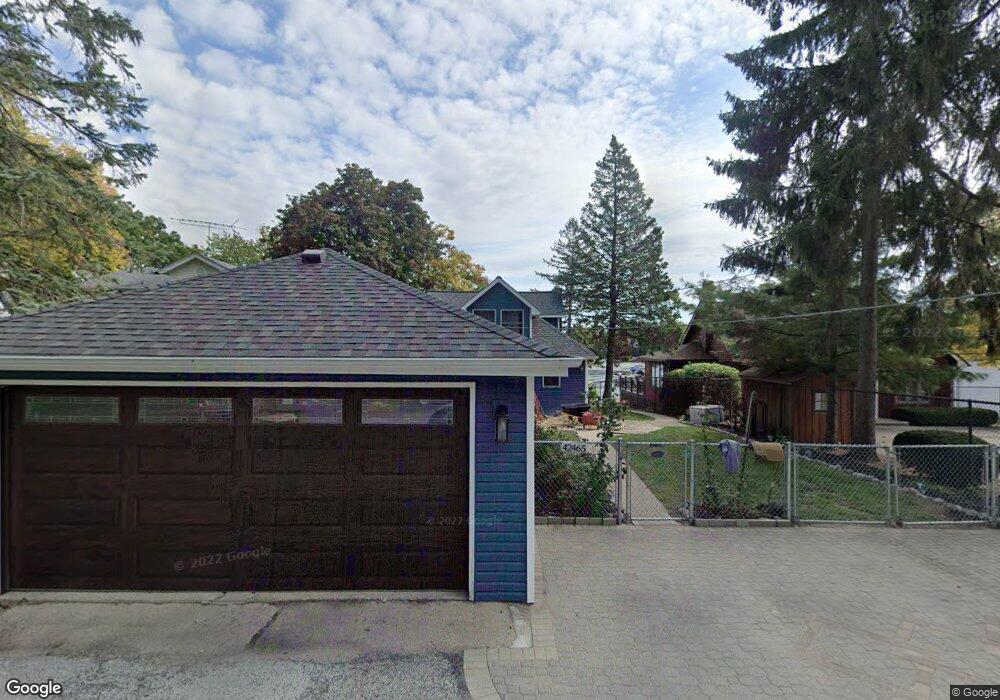
42465 N Orchard St Antioch, IL 60002
Lake Catherine NeighborhoodEstimated Value: $373,000 - $414,000
2
Beds
3
Baths
1,596
Sq Ft
$245/Sq Ft
Est. Value
About This Home
This home is located at 42465 N Orchard St, Antioch, IL 60002 and is currently estimated at $391,805, approximately $245 per square foot. 42465 N Orchard St is a home located in Lake County with nearby schools including Antioch Community High School.
Ownership History
Date
Name
Owned For
Owner Type
Purchase Details
Closed on
Mar 23, 2024
Sold by
Najdowski Amanda and Knight Scott D
Bought by
Knight Scott D
Current Estimated Value
Purchase Details
Closed on
Apr 28, 2015
Sold by
Bilbo Michael Thomas and Bilbo David Allen
Bought by
Najdowski Amanda and Knight Scott D
Home Financials for this Owner
Home Financials are based on the most recent Mortgage that was taken out on this home.
Original Mortgage
$186,000
Interest Rate
4.25%
Mortgage Type
New Conventional
Purchase Details
Closed on
Dec 3, 2012
Sold by
Bilbo Thomas Raymond
Bought by
Bilbo Thomas Raymond and Thomas Raymond Bilbo Revocable Trust
Purchase Details
Closed on
Jul 5, 2006
Sold by
Bilbo Thomas R and Heynis Janet
Bought by
Bilbo Thomas R
Purchase Details
Closed on
Sep 29, 1995
Sold by
Bilbo Verna M
Bought by
Bilbo Thomas R and Heynis Janet
Create a Home Valuation Report for This Property
The Home Valuation Report is an in-depth analysis detailing your home's value as well as a comparison with similar homes in the area
Home Values in the Area
Average Home Value in this Area
Purchase History
| Date | Buyer | Sale Price | Title Company |
|---|---|---|---|
| Knight Scott D | -- | None Listed On Document | |
| Najdowski Amanda | $232,500 | None Available | |
| Bilbo Thomas Raymond | -- | None Available | |
| Bilbo Thomas R | -- | None Available | |
| Bilbo Thomas R | -- | -- | |
| Bilbo Verna M | -- | -- |
Source: Public Records
Mortgage History
| Date | Status | Borrower | Loan Amount |
|---|---|---|---|
| Previous Owner | Najdowski Amanda | $186,000 |
Source: Public Records
Tax History Compared to Growth
Tax History
| Year | Tax Paid | Tax Assessment Tax Assessment Total Assessment is a certain percentage of the fair market value that is determined by local assessors to be the total taxable value of land and additions on the property. | Land | Improvement |
|---|---|---|---|---|
| 2024 | $9,705 | $116,465 | $28,360 | $88,105 |
| 2023 | $9,769 | $104,285 | $25,394 | $78,891 |
| 2022 | $9,769 | $101,048 | $23,127 | $77,921 |
| 2021 | $9,045 | $94,288 | $21,580 | $72,708 |
| 2020 | $8,565 | $91,684 | $20,984 | $70,700 |
| 2019 | $8,719 | $87,677 | $20,067 | $67,610 |
| 2018 | $8,712 | $89,282 | $20,366 | $68,916 |
| 2017 | $8,638 | $84,982 | $19,385 | $65,597 |
| 2016 | $8,425 | $79,515 | $18,708 | $60,807 |
| 2015 | $9,074 | $78,101 | $18,232 | $59,869 |
| 2014 | $8,718 | $77,907 | $22,806 | $55,101 |
| 2012 | $8,510 | $80,807 | $22,806 | $58,001 |
Source: Public Records
Map
Nearby Homes
- 42425 N Park Ln
- 42136 N 7th Ave
- 25174 W Claridan Ave
- 25076 W Edgar Ave
- 25022 W Catherine Ave
- 25118 W Catherine Ave
- 42161 N 1st Ave
- 42385 N Woodbine Ave
- 1137 Oak Point Ct
- Newport - Two-story Plan at Woodland Ridge
- Madison - Two-story Plan at Woodland Ridge
- Jefferson - Two-story Plan at Woodland Ridge
- Monroe II - Two-story Plan at Woodland Ridge
- Truman III - Two-story Plan at Woodland Ridge
- Dawson - Two-story Plan at Woodland Ridge
- Elway - Ranch Plan at Woodland Ridge
- Pasadena II - Ranch Plan at Woodland Ridge
- Harrison - Ranch Plan at Woodland Ridge
- Adams III - Ranch Plan at Woodland Ridge
- Lincoln - Ranch Plan at Woodland Ridge
- 42465 N Orchard St
- 42471 N Orchard St
- 42453 N Orchard St
- 42479 N Linden Ln
- 42470 N Orchard St
- 42431 N Orchard St
- 42431 N Orchard St
- 42515 N Linden Ln
- 42434 N Orchard St
- 42427 N Orchard St
- 42430 N Orchard St
- 42521 N Linden Ln
- 42417 N Orchard St
- 42471 N Linden Ln
- 42453 N Linden Ln
- 42428 N Orchard St
- 42403 N Orchard St
- 42435 N Linden Ln
- 42414 N Orchard St
- 42528 N Witt Rd