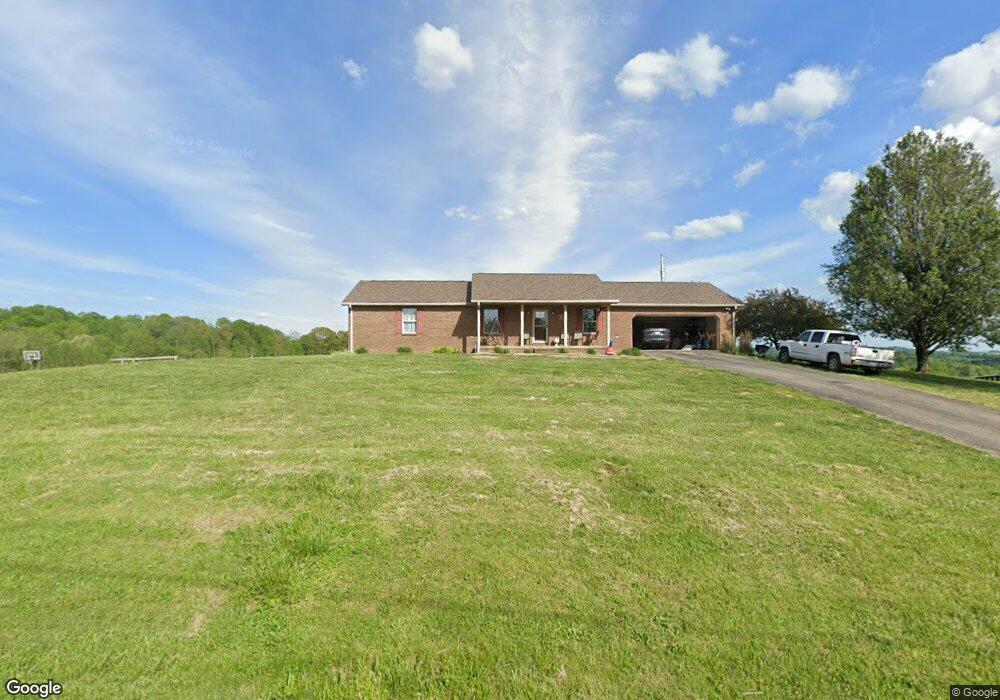
4247 Mount Gilboa Rd Campbellsville, KY 42718
Estimated Value: $210,000 - $595,000
3
Beds
2
Baths
1,752
Sq Ft
$230/Sq Ft
Est. Value
About This Home
This home is located at 4247 Mount Gilboa Rd, Campbellsville, KY 42718 and is currently estimated at $402,500, approximately $229 per square foot. 4247 Mount Gilboa Rd is a home located in Taylor County with nearby schools including Taylor County Elementary School, Taylor County Middle School, and Taylor County High School.
Ownership History
Date
Name
Owned For
Owner Type
Purchase Details
Closed on
Dec 2, 2022
Sold by
Hunt Robert Thomas and Hunt Deanna Carol
Bought by
Coomer Stephen and Coomer Samantha Carol
Current Estimated Value
Purchase Details
Closed on
Aug 29, 2022
Sold by
Spalding Joseph H and Spalding Joyce H
Bought by
Joseph H Spalding And Joyce H Spalding Joint
Purchase Details
Closed on
May 17, 2022
Sold by
Hunt Robert T and Hunt Deanna C
Bought by
Spalding Joe H and Spalding Joyce H
Purchase Details
Closed on
Aug 18, 2021
Sold by
Faulkner and Donna
Bought by
Hunt Robert T and Hunt Deanna C
Home Financials for this Owner
Home Financials are based on the most recent Mortgage that was taken out on this home.
Original Mortgage
$467,500
Interest Rate
2.8%
Mortgage Type
New Conventional
Purchase Details
Closed on
Apr 16, 2019
Sold by
Isaacs David V and Isaacs Judy B
Bought by
Hunt Robert T and Hunt Deanna C
Create a Home Valuation Report for This Property
The Home Valuation Report is an in-depth analysis detailing your home's value as well as a comparison with similar homes in the area
Home Values in the Area
Average Home Value in this Area
Purchase History
| Date | Buyer | Sale Price | Title Company |
|---|---|---|---|
| Coomer Stephen | -- | -- | |
| Joseph H Spalding And Joyce H Spalding Joint | $832,000 | -- | |
| Spalding Joe H | $832,000 | Mattingly Joseph H | |
| Hunt Robert T | $30,000 | None Listed On Document | |
| Hunt Robert T | $65,000 | None Available |
Source: Public Records
Mortgage History
| Date | Status | Borrower | Loan Amount |
|---|---|---|---|
| Previous Owner | Hunt Robert T | $467,500 |
Source: Public Records
Tax History Compared to Growth
Tax History
| Year | Tax Paid | Tax Assessment Tax Assessment Total Assessment is a certain percentage of the fair market value that is determined by local assessors to be the total taxable value of land and additions on the property. | Land | Improvement |
|---|---|---|---|---|
| 2025 | $2,082 | $215,000 | $0 | $0 |
| 2024 | $2,110 | $215,000 | $0 | $0 |
| 2023 | $1,205 | $118,500 | $0 | $0 |
| 2022 | $1,224 | $118,500 | $0 | $0 |
| 2021 | $1,219 | $118,500 | $0 | $0 |
| 2020 | $1,246 | $118,500 | $0 | $0 |
| 2019 | $1,090 | $103,500 | $0 | $0 |
| 2018 | $1,071 | $103,500 | $0 | $0 |
| 2017 | $1,048 | $103,500 | $0 | $0 |
| 2016 | $1,023 | $103,500 | $0 | $0 |
| 2015 | $1,018 | $103,500 | $0 | $0 |
| 2014 | $996 | $103,500 | $0 | $0 |
| 2012 | -- | $103,500 | $0 | $0 |
Source: Public Records
Map
Nearby Homes
- 3775 Mount Gilboa Rd
- 2995 W Finley Ridge Rd
- 9701 Saloma Rd
- 1588 Sanders Rd
- 0 Green Hollow Rd Unit LotWP001 24042672
- 0 Green Hollow Rd
- 1150 Clear Creek Rd
- 0 Ferrell Ln Unit HK25003832
- 0 Ferrell Ln Unit HK25003829
- 0 Ferrell Ln Unit HK25003831
- 0 Ferrell Ln Unit HK25003833
- 0 Ferrell Ln Unit HK25003830
- 0 Ferrell Ln Unit HK25003827
- 0 Ferrell Ln Unit HK25003835
- 0 Ferrell Ln Unit HK25003828
- 23 Drew Ln
- 6600 Saloma Rd
- 6467 Old Lebanon Rd
- 6213 Old Lebanon Rd
- 2235 Larry Hunt Rd
- 4377 Mount Gilboa Rd
- 3494 W Finley Ridge Rd
- 3668 W Finley Ridge Rd
- 4840 Mount Gilboa Rd
- 3694 Mount Gilboa Rd
- 3694 Mt Gilboa Rd
- 3612 W Finley Ridge Rd
- 4945 Mount Gilboa Rd
- 4610 Mount Gilboa Rd
- 3720 W Finley Ridge Rd
- 3780 W Finley Ridge Rd
- 4130 W Finley Ridge Rd
- 5049 Mount Gilboa Rd
- 3460 W Finley Ridge Rd
- 3187 Mount Gilboa Rd
- 2989 Mount Gilboa Rd
- 346 Dragons Way
- 485 Harlan Caulk Rd
- 485 Harlan Caulk Rd
- 4215 W Finley Ridge Rd