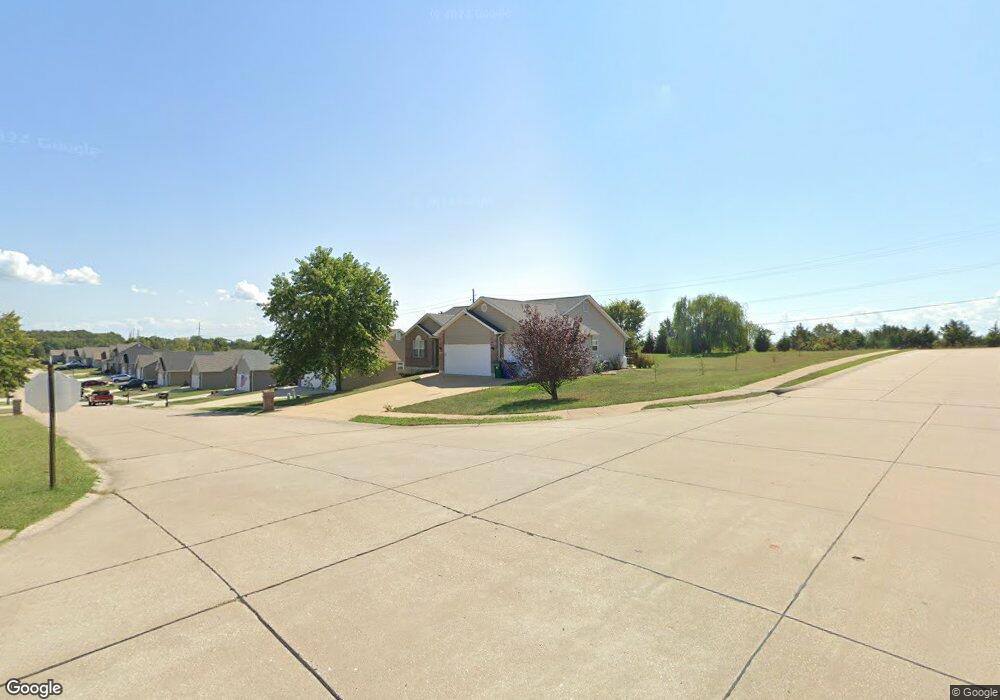
4248 Lockeport Landing Hillsboro, MO 63050
Estimated Value: $369,755 - $398,000
3
Beds
2
Baths
1,732
Sq Ft
$224/Sq Ft
Est. Value
About This Home
This home is located at 4248 Lockeport Landing, Hillsboro, MO 63050 and is currently estimated at $387,189, approximately $223 per square foot. 4248 Lockeport Landing is a home located in Jefferson County with nearby schools including Hillsboro Primary School, Hillsboro Elementary School, and Hillsboro Middle Elementary School.
Ownership History
Date
Name
Owned For
Owner Type
Purchase Details
Closed on
May 3, 2013
Sold by
Brinkman Lindsey and Brinkman Alexander
Bought by
Mckim Melissa R and Mckim Christopher A
Current Estimated Value
Home Financials for this Owner
Home Financials are based on the most recent Mortgage that was taken out on this home.
Original Mortgage
$166,920
Outstanding Balance
$117,051
Interest Rate
3.25%
Mortgage Type
FHA
Estimated Equity
$270,138
Purchase Details
Closed on
Aug 14, 2008
Sold by
Stonebrook Construction Inc
Bought by
Cable Lindsey and Brinkman Alexander
Home Financials for this Owner
Home Financials are based on the most recent Mortgage that was taken out on this home.
Original Mortgage
$192,329
Interest Rate
6.38%
Mortgage Type
FHA
Create a Home Valuation Report for This Property
The Home Valuation Report is an in-depth analysis detailing your home's value as well as a comparison with similar homes in the area
Home Values in the Area
Average Home Value in this Area
Purchase History
| Date | Buyer | Sale Price | Title Company |
|---|---|---|---|
| Mckim Melissa R | -- | None Available | |
| Cable Lindsey | -- | Htc |
Source: Public Records
Mortgage History
| Date | Status | Borrower | Loan Amount |
|---|---|---|---|
| Open | Mckim Melissa R | $166,920 | |
| Previous Owner | Cable Lindsey | $192,329 |
Source: Public Records
Tax History Compared to Growth
Tax History
| Year | Tax Paid | Tax Assessment Tax Assessment Total Assessment is a certain percentage of the fair market value that is determined by local assessors to be the total taxable value of land and additions on the property. | Land | Improvement |
|---|---|---|---|---|
| 2025 | $2,961 | $51,000 | $10,700 | $40,300 |
| 2024 | $2,961 | $47,200 | $10,700 | $36,500 |
| 2023 | $2,961 | $47,200 | $10,700 | $36,500 |
| 2022 | $2,666 | $41,800 | $7,000 | $34,800 |
| 2021 | $2,848 | $41,800 | $7,000 | $34,800 |
| 2020 | $2,601 | $37,000 | $6,100 | $30,900 |
| 2019 | $2,601 | $37,000 | $6,100 | $30,900 |
| 2018 | $2,600 | $37,000 | $6,100 | $30,900 |
| 2017 | $2,471 | $37,000 | $6,100 | $30,900 |
| 2016 | $2,322 | $34,400 | $6,000 | $28,400 |
| 2015 | $2,144 | $34,400 | $6,000 | $28,400 |
| 2013 | $2,144 | $34,100 | $6,000 | $28,100 |
Source: Public Records
Map
Nearby Homes
- 9904 Lockeport Point
- 4453 Mockingbird Ln
- 4295 Hansard Ln
- 4 Cedar Creek
- 127 N Lake Dr
- 10610 Stroup Rd
- 176 Pancho Villa Dr
- 0 Tbb-Twin Pines-Del Rio Unit MAR25024441
- 4005 Twinbrook Rd
- 208 Red Maple
- 9618 Red Maple
- 10284 Micah Ln
- 10430 Business 21
- 9449 Hillsboro-House Springs Rd
- 9822 Woodland Rd
- 5001 Boyd Farm Rd
- 569 Karen Dr
- 4625 Cedar Dr
- 6005 Elm
- 712 Maple St
- 4244 Lockeport Landing
- 4240 Lockeport Landing
- 4302 Lockeport Landing
- 10034 Middleton Way
- 4236 Lockeport Landing
- 4241 Lockeport Landing
- 4301 Lockeport Landing
- 4306 Lockeport Landing
- 10030 Middleton Way
- 4232 Lockeport Landing
- 4237 Lockeport Landing
- 4305 Lockeport Landing
- 4233 Lockeport Landing
- 4310 Lockeport Landing
- 10026 Middleton Way
- 200 Hartland Ct
- 4309 Lockeport Landing
- 4229 Lockeport Landing
- 640 Louisbourg Dr
- 636 Louisbourg Dr