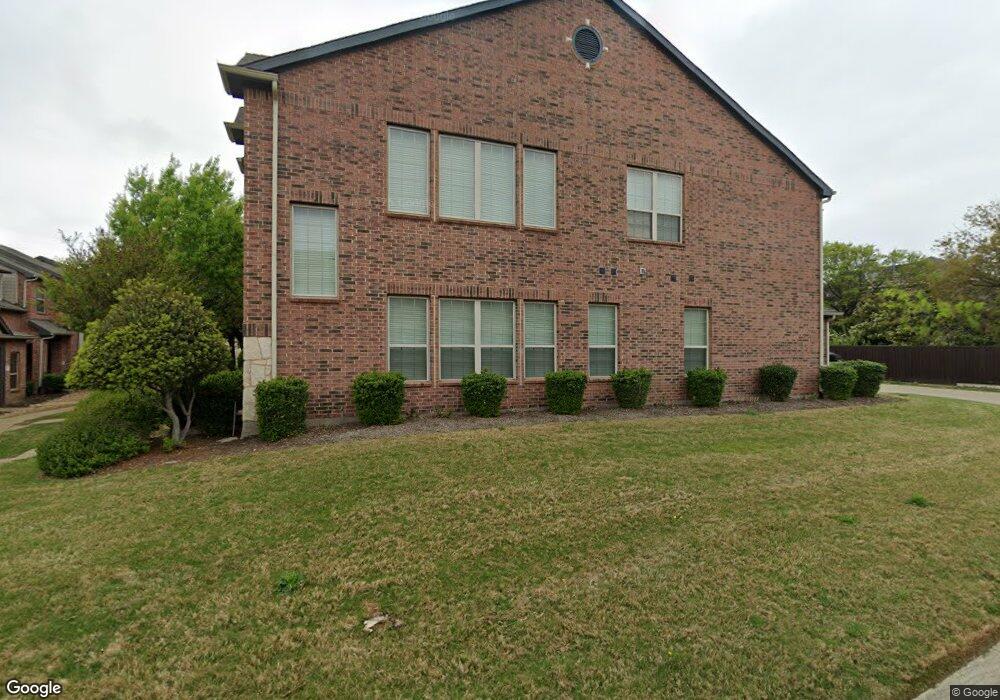
4249 Swan Forest Dr Unit E Carrollton, TX 75010
North Central Carrollton NeighborhoodEstimated Value: $371,839 - $402,000
3
Beds
3
Baths
1,863
Sq Ft
$208/Sq Ft
Est. Value
About This Home
This home is located at 4249 Swan Forest Dr Unit E, Carrollton, TX 75010 and is currently estimated at $386,960, approximately $207 per square foot. 4249 Swan Forest Dr Unit E is a home located in Denton County with nearby schools including Polser Elementary School, Creek Valley Middle School, and Hebron High School.
Ownership History
Date
Name
Owned For
Owner Type
Purchase Details
Closed on
Feb 11, 2015
Sold by
Anderson Renee
Bought by
Gu Michael
Current Estimated Value
Home Financials for this Owner
Home Financials are based on the most recent Mortgage that was taken out on this home.
Original Mortgage
$180,000
Outstanding Balance
$138,676
Interest Rate
3.92%
Mortgage Type
New Conventional
Estimated Equity
$248,284
Purchase Details
Closed on
Apr 18, 2012
Sold by
Peterson Skye A and Peterson Shannon
Bought by
Anderson Renee
Home Financials for this Owner
Home Financials are based on the most recent Mortgage that was taken out on this home.
Original Mortgage
$139,200
Interest Rate
3.92%
Mortgage Type
New Conventional
Purchase Details
Closed on
Feb 25, 2009
Sold by
Rh Of Texas Limited Partnership
Bought by
Peterson Skye A
Home Financials for this Owner
Home Financials are based on the most recent Mortgage that was taken out on this home.
Original Mortgage
$194,336
Interest Rate
4.92%
Mortgage Type
FHA
Create a Home Valuation Report for This Property
The Home Valuation Report is an in-depth analysis detailing your home's value as well as a comparison with similar homes in the area
Home Values in the Area
Average Home Value in this Area
Purchase History
| Date | Buyer | Sale Price | Title Company |
|---|---|---|---|
| Gu Michael | -- | Lawyers Title | |
| Anderson Renee | -- | None Available | |
| Peterson Skye A | -- | Rtc |
Source: Public Records
Mortgage History
| Date | Status | Borrower | Loan Amount |
|---|---|---|---|
| Open | Gu Michael | $180,000 | |
| Previous Owner | Anderson Renee | $139,200 | |
| Previous Owner | Peterson Skye A | $194,336 |
Source: Public Records
Tax History
| Year | Tax Paid | Tax Assessment Tax Assessment Total Assessment is a certain percentage of the fair market value that is determined by local assessors to be the total taxable value of land and additions on the property. | Land | Improvement |
|---|---|---|---|---|
| 2025 | $7,083 | $348,000 | $56,710 | $291,290 |
| 2024 | $7,083 | $384,000 | $56,710 | $327,290 |
| 2023 | $7,550 | $403,000 | $56,710 | $346,290 |
| 2022 | $6,233 | $309,066 | $56,710 | $252,356 |
| 2021 | $6,266 | $290,139 | $62,434 | $227,705 |
| 2020 | $6,129 | $284,709 | $62,434 | $222,275 |
| 2019 | $6,318 | $283,548 | $62,434 | $221,114 |
| 2018 | $6,089 | $271,210 | $62,434 | $208,776 |
| 2017 | $5,733 | $252,331 | $62,434 | $189,897 |
| 2016 | $4,829 | $212,515 | $32,100 | $180,415 |
| 2015 | -- | $190,134 | $32,100 | $158,034 |
| 2013 | -- | $156,638 | $32,100 | $124,538 |
Source: Public Records
Map
Nearby Homes
- 4245-B Swan Forest Dr Unit B
- 4225 Swan Forest Dr Unit C
- 1628 Black Duck Terrace
- 2420 Damsel Katie Dr
- 1708 Brookview Dr
- 1224 Damsel Grey Trail
- 1825 Brookview Dr
- 1737 Flowers Dr
- 1857 Brookview Dr
- 1727 E Branch Hollow Dr
- 1016 Lady Lore Ln
- 2624 Grail Maiden Ct
- 1718 E Branch Hollow Dr
- 1806 E Branch Hollow Dr
- 1209 Queen Peggy Ln
- 1101 King Mark Dr
- 4108 Medical Pkwy
- 1837 Amber Ln
- 2500 King Arthur Blvd Unit 306
- 1314 Red Maple Dr
- 4249 Swan Forest Dr Unit A
- 4249 Swan Forest Dr Unit B
- 4249 Swan Forest Dr Unit C
- 4249 Swan Forest Dr Unit D
- 4249 Swan Forest Dr Unit F
- 4249 Swan Forest Dr
- 4245 Swan Forest Dr Unit F
- 4245 Swan Forest Dr Unit E
- 4245 Swan Forest Dr Unit D
- 4245 Swan Forest Dr Unit C
- 4245 Swan Forest Dr Unit B
- 4245 Swan Forest Dr Unit A
- 4245 Swan Forest Dr
- 1301 Livy Ln
- 1305 Livy Ln
- 2532 Sir Tristram Ln
- 2530 Sir Tristram Ln
- 4237 Swan Forest Dr Unit A
- 4237 Swan Forest Dr Unit B
- 4237 Swan Forest Dr Unit C
Your Personal Tour Guide
Ask me questions while you tour the home.