Estimated Value: $458,000 - $492,000
3
Beds
3
Baths
2,464
Sq Ft
$193/Sq Ft
Est. Value
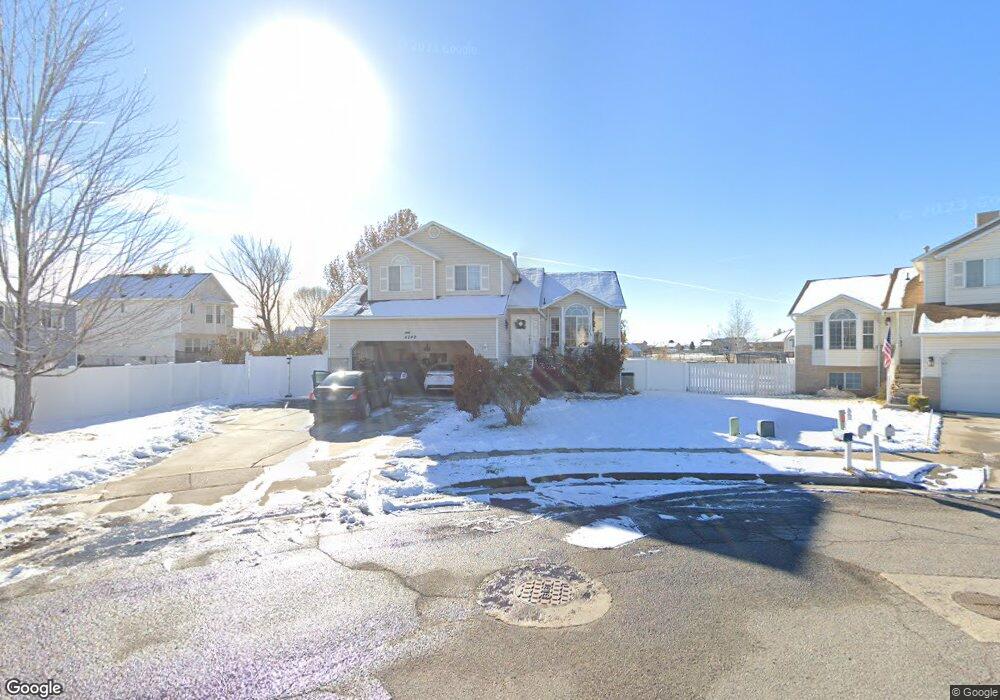
About This Home
This home is located at 4249 W 5400 S, Roy, UT 84067 and is currently estimated at $475,929, approximately $193 per square foot. 4249 W 5400 S is a home located in Weber County with nearby schools including Country View School, Rocky Mountain Junior High School, and Bridge Elementary School.
Ownership History
Date
Name
Owned For
Owner Type
Purchase Details
Closed on
Apr 28, 2023
Sold by
Kowsari Mehdi and Kowsari Mozhgan
Bought by
Mehdi Kowsari And Mozhgan Kowsari Revocable T and Kowsari
Current Estimated Value
Purchase Details
Closed on
Aug 5, 2008
Sold by
Kowsari Mozhgan
Bought by
Kowsari Mozhgan and Kowsari Mehdi
Home Financials for this Owner
Home Financials are based on the most recent Mortgage that was taken out on this home.
Original Mortgage
$198,940
Interest Rate
6.42%
Mortgage Type
FHA
Purchase Details
Closed on
Dec 21, 2000
Sold by
Dr Horton Inc
Bought by
Stacey Christopher R
Home Financials for this Owner
Home Financials are based on the most recent Mortgage that was taken out on this home.
Original Mortgage
$145,396
Interest Rate
7.81%
Mortgage Type
FHA
Create a Home Valuation Report for This Property
The Home Valuation Report is an in-depth analysis detailing your home's value as well as a comparison with similar homes in the area
Home Values in the Area
Average Home Value in this Area
Purchase History
| Date | Buyer | Sale Price | Title Company |
|---|---|---|---|
| Mehdi Kowsari And Mozhgan Kowsari Revocable T | -- | None Listed On Document | |
| Kowsari Mozhgan | -- | Accommodation | |
| Kowsari Mozhgan | -- | Utah Commercial Title | |
| Kowsari Mozhgan | -- | Utah Commercial Title | |
| Stacey Christopher R | -- | -- |
Source: Public Records
Mortgage History
| Date | Status | Borrower | Loan Amount |
|---|---|---|---|
| Previous Owner | Kowsari Mozhgan | $198,940 | |
| Previous Owner | Stacey Christopher R | $145,396 |
Source: Public Records
Tax History
| Year | Tax Paid | Tax Assessment Tax Assessment Total Assessment is a certain percentage of the fair market value that is determined by local assessors to be the total taxable value of land and additions on the property. | Land | Improvement |
|---|---|---|---|---|
| 2025 | $2,832 | $451,674 | $137,049 | $314,625 |
| 2024 | $2,764 | $244,199 | $75,376 | $168,823 |
| 2023 | $2,718 | $240,900 | $72,747 | $168,153 |
| 2022 | $3,004 | $276,100 | $62,493 | $213,607 |
| 2021 | $2,289 | $343,000 | $86,973 | $256,027 |
| 2020 | $2,224 | $307,000 | $86,973 | $220,027 |
| 2019 | $2,133 | $277,000 | $50,963 | $226,037 |
| 2018 | $2,103 | $258,000 | $47,902 | $210,098 |
| 2017 | $1,977 | $227,000 | $47,902 | $179,098 |
| 2016 | $1,817 | $111,684 | $23,685 | $87,999 |
| 2015 | $1,619 | $101,256 | $23,685 | $77,571 |
| 2014 | $1,555 | $95,824 | $20,888 | $74,936 |
Source: Public Records
Map
Nearby Homes
Your Personal Tour Guide
Ask me questions while you tour the home.