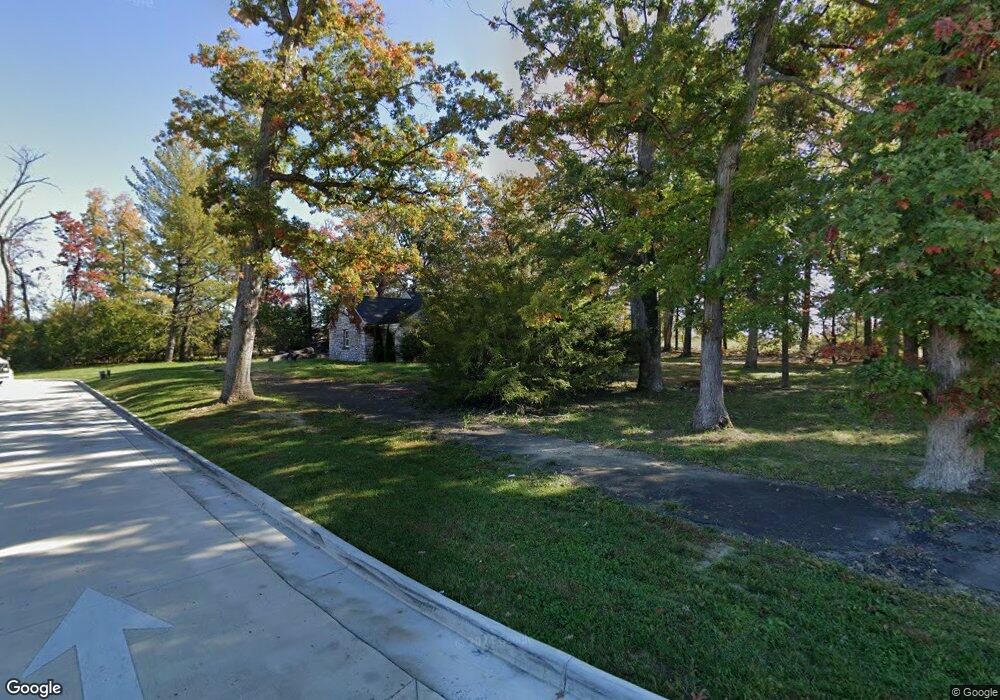
4249 Winchester Rd Marshall, VA 20115
Estimated Value: $789,000 - $1,132,000
3
Beds
3
Baths
2,960
Sq Ft
$330/Sq Ft
Est. Value
About This Home
This home is located at 4249 Winchester Rd, Marshall, VA 20115 and is currently estimated at $976,366, approximately $329 per square foot. 4249 Winchester Rd is a home located in Fauquier County with nearby schools including Claude Thompson Elementary School, Marshall Middle School, and Fauquier High School.
Ownership History
Date
Name
Owned For
Owner Type
Purchase Details
Closed on
Nov 29, 2021
Sold by
Ramadan Gihan
Bought by
Marshall 17-66 Station Llc
Current Estimated Value
Purchase Details
Closed on
Oct 4, 2021
Sold by
Ramadan Gihan and Samman Ghalib Marwan
Bought by
Ramadan Gihan
Purchase Details
Closed on
Nov 4, 2016
Sold by
Ramadan Gihan
Bought by
Ramadan Gihan and Samman Ghalib Marwan
Purchase Details
Closed on
Oct 10, 2006
Sold by
Peterson John
Bought by
Moshari Ali
Home Financials for this Owner
Home Financials are based on the most recent Mortgage that was taken out on this home.
Original Mortgage
$638,000
Interest Rate
6.47%
Mortgage Type
New Conventional
Purchase Details
Closed on
Dec 3, 2002
Sold by
Mills Carlin W
Bought by
Peterson John M
Home Financials for this Owner
Home Financials are based on the most recent Mortgage that was taken out on this home.
Original Mortgage
$340,000
Interest Rate
6.34%
Mortgage Type
New Conventional
Create a Home Valuation Report for This Property
The Home Valuation Report is an in-depth analysis detailing your home's value as well as a comparison with similar homes in the area
Purchase History
| Date | Buyer | Sale Price | Title Company |
|---|---|---|---|
| Marshall 17-66 Station Llc | $825,000 | None Listed On Document | |
| Ramadan Gihan | -- | None Available | |
| Ramadan Gihan | -- | None Available | |
| Moshari Ali | $850,000 | -- | |
| Peterson John M | $425,000 | -- |
Source: Public Records
Mortgage History
| Date | Status | Borrower | Loan Amount |
|---|---|---|---|
| Previous Owner | Moshari Ali | $638,000 | |
| Previous Owner | Peterson John M | $340,000 |
Source: Public Records
Tax History
| Year | Tax Paid | Tax Assessment Tax Assessment Total Assessment is a certain percentage of the fair market value that is determined by local assessors to be the total taxable value of land and additions on the property. | Land | Improvement |
|---|---|---|---|---|
| 2025 | $8,742 | $881,200 | $731,800 | $149,400 |
| 2024 | $8,544 | $881,200 | $731,800 | $149,400 |
| 2023 | $8,191 | $881,200 | $731,800 | $149,400 |
| 2022 | $8,191 | $881,200 | $731,800 | $149,400 |
| 2021 | $5,853 | $573,000 | $170,200 | $402,800 |
| 2020 | $5,738 | $573,000 | $170,200 | $402,800 |
| 2019 | $5,738 | $573,000 | $170,200 | $402,800 |
| 2018 | $5,669 | $573,000 | $170,200 | $402,800 |
| 2016 | $4,695 | $448,400 | $167,000 | $281,400 |
| 2015 | -- | $448,400 | $167,000 | $281,400 |
| 2014 | -- | $448,400 | $167,000 | $281,400 |
Source: Public Records
Map
Nearby Homes
- 0 Main St E Unit VAFQ2016288
- 8611 Harrison Ct
- 4519 Appledale Ct
- 4530 Appledale Ct
- 1045 Captain Richards Ct Unit HOMESITE 141
- 1043 Captain Richards Ct Unit HOMESITE 142
- 8332 Mauzy Square
- 1010 Captain Richards Ct Unit HOMESITE 175
- 3586 Stephensons Hill Ln
- 3588 Stephensons Hill Ln
- 8089 E Main St
- 2611 Blue Ridge Ave Unit HOMESITE 139
- 2576 Blue Ridge Ave Unit HOMESITE 115
- 2593 Blue Ridge Ave Unit HOMESITE 157
- 0 Old Stockyard Rd
- 6053 Cobblestone Ct
- 6052 Cobblestone Ct
- 4048 Rectortown Rd
- 8650 Anderson Ave
- 3961 Rectortown Rd
- 4263 Winchester Rd
- 4579 Whiting Rd
- 8299 Brampton Ct
- 8297 Brampton Ct
- 4553 Whiting Rd
- 4601 Whiting Rd
- 4603 Whiting Rd
- 4244 Winchester Rd
- 4242 Winchester Rd
- 4250 Winchester Rd
- 20115 Whiting Rd
- 4234 Winchester Rd
- 4273 Winchester Rd
- 4273 Winchester Rd
- 4273 Winchester Rd
- 4273 Winchester Rd
- 4228 Winchester Rd
- 4215 Winchester Rd
- 4220 Winchester Rd
- 4212 Winchester Rd
Your Personal Tour Guide
Ask me questions while you tour the home.