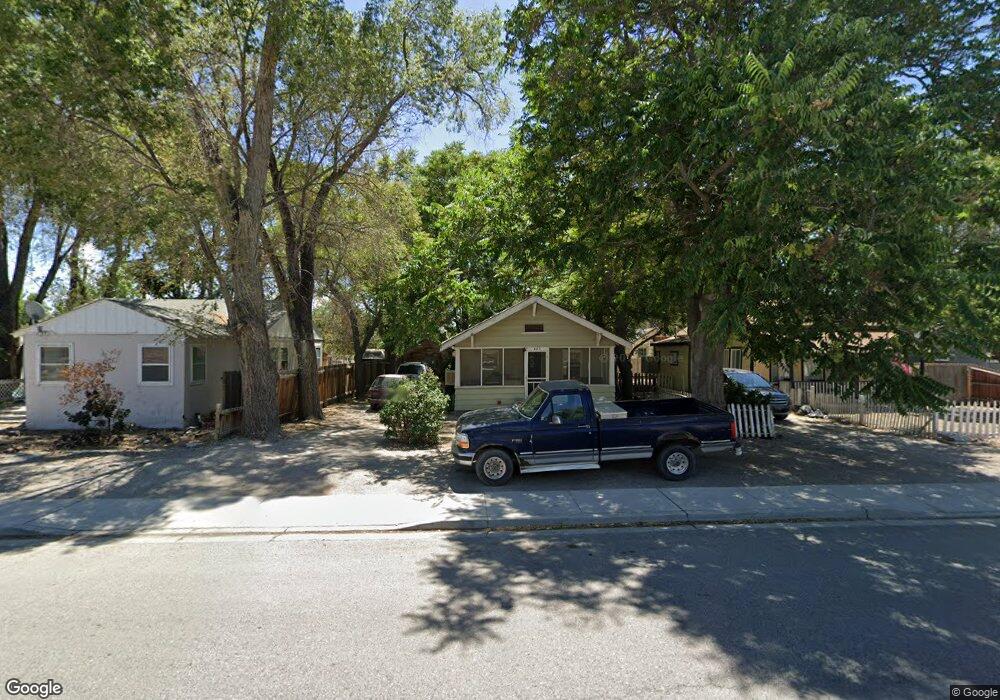
425 14th St Lovelock, NV 89419
Estimated Value: $88,000 - $205,339
1
Bed
1
Bath
740
Sq Ft
$194/Sq Ft
Est. Value
About This Home
This home is located at 425 14th St, Lovelock, NV 89419 and is currently estimated at $143,585, approximately $194 per square foot. 425 14th St is a home with nearby schools including Pershing County Middle School and Pershing County High School.
Ownership History
Date
Name
Owned For
Owner Type
Purchase Details
Closed on
Dec 29, 2024
Sold by
Monteith Olin E
Bought by
Mcgrady William Scott
Current Estimated Value
Home Financials for this Owner
Home Financials are based on the most recent Mortgage that was taken out on this home.
Original Mortgage
$200,000
Outstanding Balance
$198,603
Interest Rate
6.78%
Mortgage Type
Seller Take Back
Estimated Equity
-$55,018
Purchase Details
Closed on
Dec 28, 2024
Sold by
Masuyama Mcgrady Miho
Bought by
Mcgrady William Scott
Home Financials for this Owner
Home Financials are based on the most recent Mortgage that was taken out on this home.
Original Mortgage
$200,000
Outstanding Balance
$198,603
Interest Rate
6.78%
Mortgage Type
Seller Take Back
Estimated Equity
-$55,018
Purchase Details
Closed on
Jan 10, 2005
Sold by
Sturges Thelma O
Bought by
Monteith Olin E
Create a Home Valuation Report for This Property
The Home Valuation Report is an in-depth analysis detailing your home's value as well as a comparison with similar homes in the area
Purchase History
| Date | Buyer | Sale Price | Title Company |
|---|---|---|---|
| Mcgrady William Scott | $300,000 | Core Title Group Llc | |
| Mcgrady William Scott | $300,000 | Core Title Group Llc | |
| Mcgrady William Scott | -- | Core Title Group Llc | |
| Mcgrady William Scott | -- | Core Title Group Llc | |
| Monteith Olin E | $35,000 | Western Title Inc |
Source: Public Records
Mortgage History
| Date | Status | Borrower | Loan Amount |
|---|---|---|---|
| Open | Mcgrady William Scott | $200,000 | |
| Closed | Mcgrady William Scott | $200,000 | |
| Closed | Monteith Olin E | $29,750 |
Source: Public Records
Tax History
| Year | Tax Paid | Tax Assessment Tax Assessment Total Assessment is a certain percentage of the fair market value that is determined by local assessors to be the total taxable value of land and additions on the property. | Land | Improvement |
|---|---|---|---|---|
| 2025 | $678 | $17,025 | $7,000 | $10,025 |
| 2024 | $678 | $14,053 | $4,200 | $9,853 |
| 2023 | $678 | $13,138 | $4,200 | $8,938 |
| 2022 | $607 | $11,773 | $4,200 | $7,573 |
| 2021 | $558 | $11,428 | $4,200 | $7,228 |
| 2020 | $555 | $11,354 | $4,200 | $7,154 |
| 2019 | $589 | $12,487 | $5,650 | $6,837 |
| 2018 | $567 | $11,664 | $5,650 | $6,014 |
| 2017 | $562 | $11,545 | $5,650 | $5,895 |
| 2016 | $558 | $11,372 | $5,650 | $5,722 |
| 2015 | $531 | $11,401 | $5,650 | $5,751 |
| 2014 | $531 | $10,751 | $5,650 | $5,101 |
Source: Public Records
Map
Nearby Homes
- APN 14th St
- 1465 Central Ave
- 750 16th St
- 1605 Central Ave
- 1645 Central Ave
- 5105 N Meridian Rd
- 1070 Cornell Ave
- T28 R31 Sec 27
- T33 R37 Sec 3
- Unionville Rd
- 680 17th St
- 2515 Upper Valley Rd
- 815 16th St
- 960 Franklin Ave
- 750 Grinnel Ave
- 635 Grinnel Ave
- 615 Grinnel Ave
- 495 Camellia Way
- 485 Camellia Way
- 470 Camellia Way