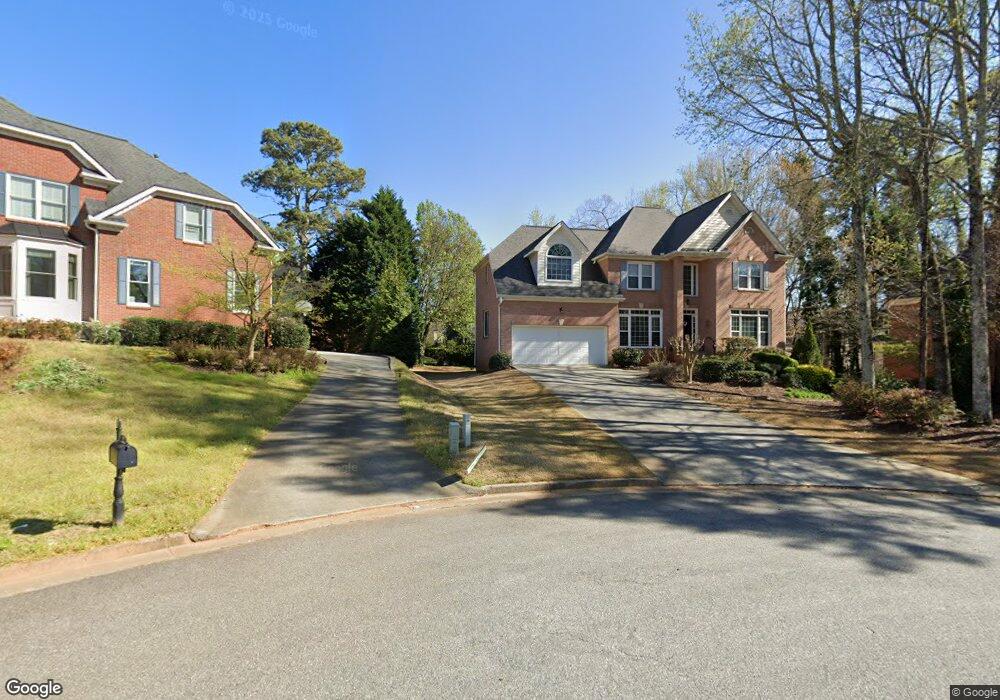
425 Brightmore Downs Unit 3 Alpharetta, GA 30005
Seven Oaks NeighborhoodEstimated Value: $889,000 - $946,000
5
Beds
5
Baths
3,243
Sq Ft
$279/Sq Ft
Est. Value
About This Home
This home is located at 425 Brightmore Downs Unit 3, Alpharetta, GA 30005 and is currently estimated at $904,228, approximately $278 per square foot. 425 Brightmore Downs Unit 3 is a home located in Fulton County with nearby schools including River Trail Middle School, Northview High School, and McGinnis Woods School.
Ownership History
Date
Name
Owned For
Owner Type
Purchase Details
Closed on
Mar 6, 2018
Sold by
Kalra Gunjan
Bought by
Kalra Gunjan
Current Estimated Value
Purchase Details
Closed on
Jun 2, 2014
Sold by
Kalra Gunjan
Bought by
Kalra Gunjan and Mahadevan Aravind
Home Financials for this Owner
Home Financials are based on the most recent Mortgage that was taken out on this home.
Original Mortgage
$364,000
Interest Rate
3.63%
Mortgage Type
New Conventional
Purchase Details
Closed on
May 30, 2014
Sold by
Reiling Stephen E
Bought by
Kalra Gunjan
Home Financials for this Owner
Home Financials are based on the most recent Mortgage that was taken out on this home.
Original Mortgage
$364,000
Interest Rate
3.63%
Mortgage Type
New Conventional
Purchase Details
Closed on
Sep 1, 1993
Sold by
Trademark Homes Inc
Bought by
Reiling Stephen E Judy C
Home Financials for this Owner
Home Financials are based on the most recent Mortgage that was taken out on this home.
Original Mortgage
$216,600
Interest Rate
7.14%
Create a Home Valuation Report for This Property
The Home Valuation Report is an in-depth analysis detailing your home's value as well as a comparison with similar homes in the area
Home Values in the Area
Average Home Value in this Area
Purchase History
| Date | Buyer | Sale Price | Title Company |
|---|---|---|---|
| Kalra Gunjan | -- | -- | |
| Kalra Gunjan | -- | -- | |
| Kalra Gunjan | $455,000 | -- | |
| Reiling Stephen E Judy C | $249,000 | -- |
Source: Public Records
Mortgage History
| Date | Status | Borrower | Loan Amount |
|---|---|---|---|
| Previous Owner | Kalra Gunjan | $364,000 | |
| Previous Owner | Reiling Stephen E Judy C | $216,600 |
Source: Public Records
Tax History
| Year | Tax Paid | Tax Assessment Tax Assessment Total Assessment is a certain percentage of the fair market value that is determined by local assessors to be the total taxable value of land and additions on the property. | Land | Improvement |
|---|---|---|---|---|
| 2025 | $9,949 | $355,320 | $79,920 | $275,400 |
| 2023 | $9,355 | $331,440 | $61,480 | $269,960 |
| 2022 | $7,689 | $250,560 | $45,920 | $204,640 |
| 2021 | $6,364 | $202,000 | $42,320 | $159,680 |
| 2020 | $6,249 | $194,120 | $30,160 | $163,960 |
| 2019 | $839 | $212,880 | $57,960 | $154,920 |
| 2018 | $6,295 | $193,280 | $56,600 | $136,680 |
| 2017 | $5,710 | $167,760 | $49,120 | $118,640 |
| 2016 | $5,627 | $167,760 | $49,120 | $118,640 |
| 2015 | $5,701 | $168,080 | $49,120 | $118,960 |
| 2014 | $4,724 | $147,000 | $43,280 | $103,720 |
Source: Public Records
Map
Nearby Homes
- 5735 Sunset Maple Dr
- 5620 Preserve Cir
- 7530 Newstead Dr
- 7170 Collingsworth Place
- 140 Ashewoode Downs Ln
- 12313 Sunset Maple Terrace
- 7505 Brookwood Way
- 5635 Ashewoode Downs Dr
- 3715 Lakeheath Dr
- 5480 Vicarage Walk
- 3180 Caney Creek Ln
- 12030 S Magnolia Cir
- 820 Yearling Chase
- 3185 Raskarity Rd
- 7260 Fawn Lake Dr
- 700 Doe Ct
- 2915 Brookwater Dr Unit 2B
- 1105 Dapplefawn Ct
- 3250 Moorstead Way
- 3250 Caney Estates Place
- 425 Brightmore Downs
- 435 Brightmore Downs Unit 3A
- 415 Brightmore Downs
- 330 Tree Lake Ct Unit 3
- 320 Tree Lake Ct Unit 3C
- 445 Brightmore Downs
- 340 Tree Lake Ct Unit 3C
- 405 Brightmore Downs
- 310 Tree Lake Ct
- 420 Brightmore Downs Unit 115
- 420 Brightmore Downs
- 430 Brightmore Downs
- 400 Brightmore Downs
- 300 Tree Lake Ct
- 350 Tree Lake Ct
- 410 Brightmore Downs Unit 3A
- 440 Brightmore Downs
- 335 Tree Lake Ct
- 325 Tree Lake Ct Unit 3C
- 105 Brightmore Way Unit 3A
Your Personal Tour Guide
Ask me questions while you tour the home.